Marquette Catholic High School in Michigan City, Indiana was one of the first schools we worked with to transform one of their classrooms into a full Financial Literacy Lab.

The Marquette program utilizes the Personal Finance Lab simulation and curriculum both in their Economics classes and their Global Trading classes, focused on investing and finance.
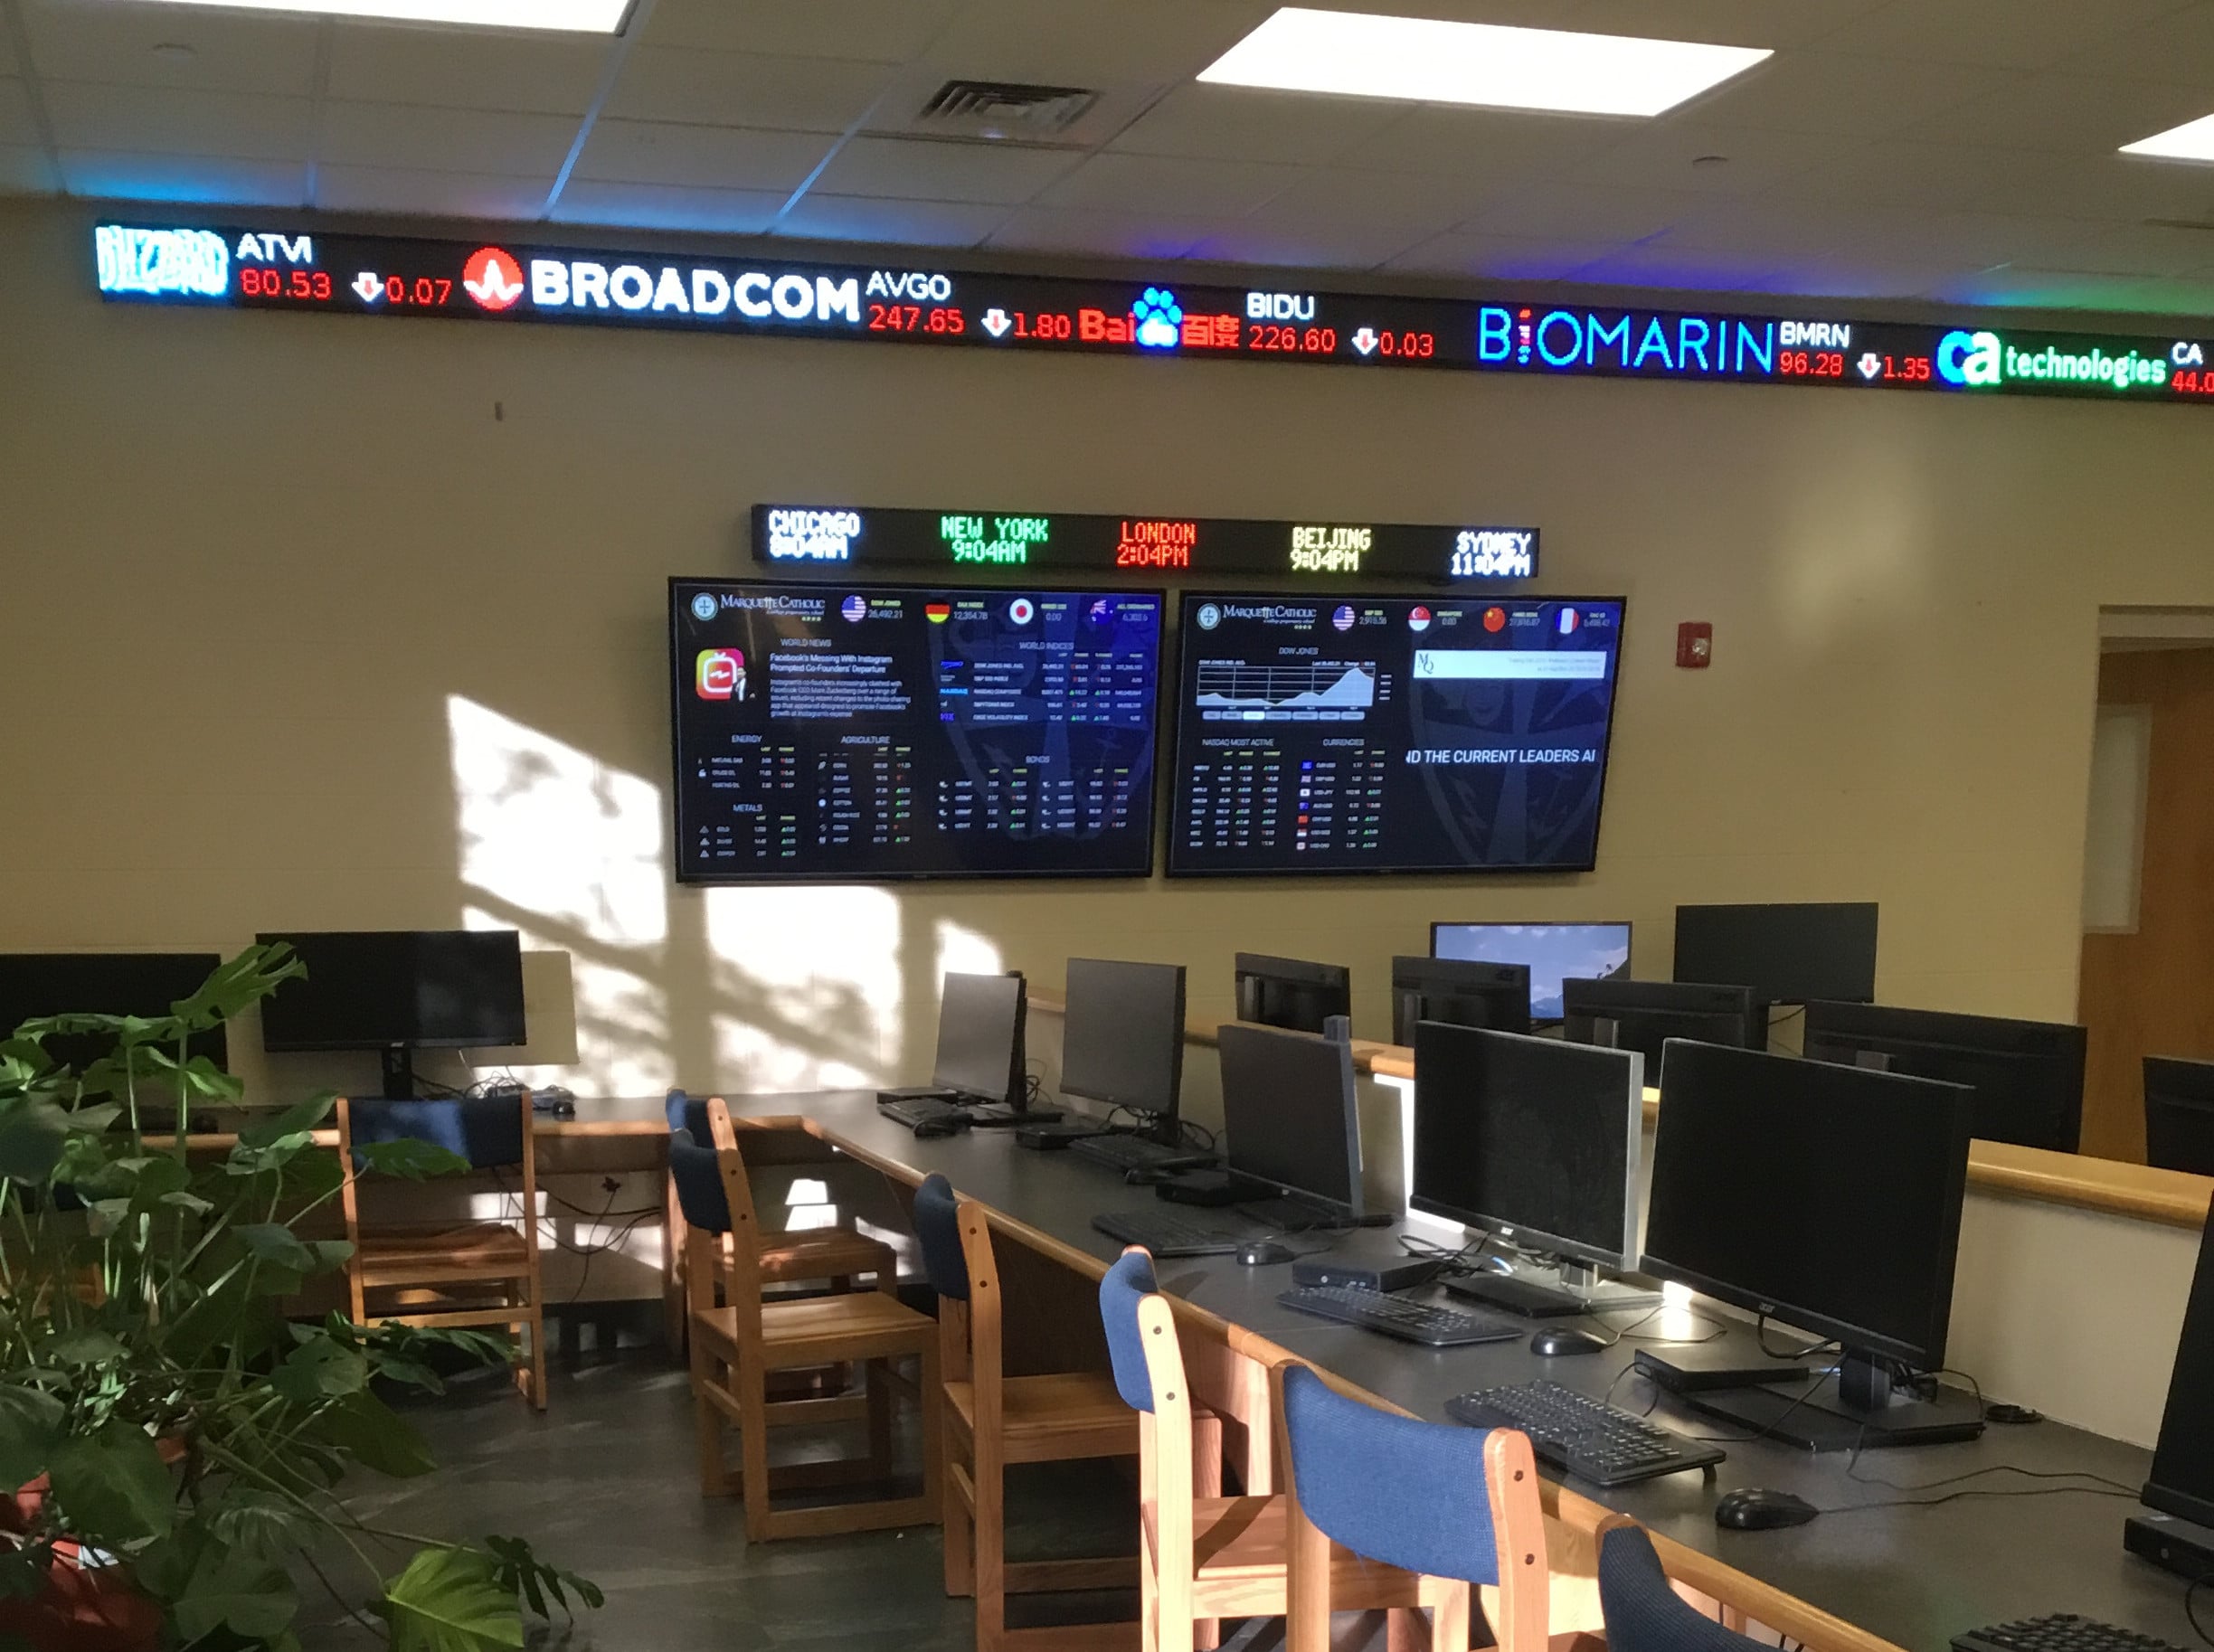
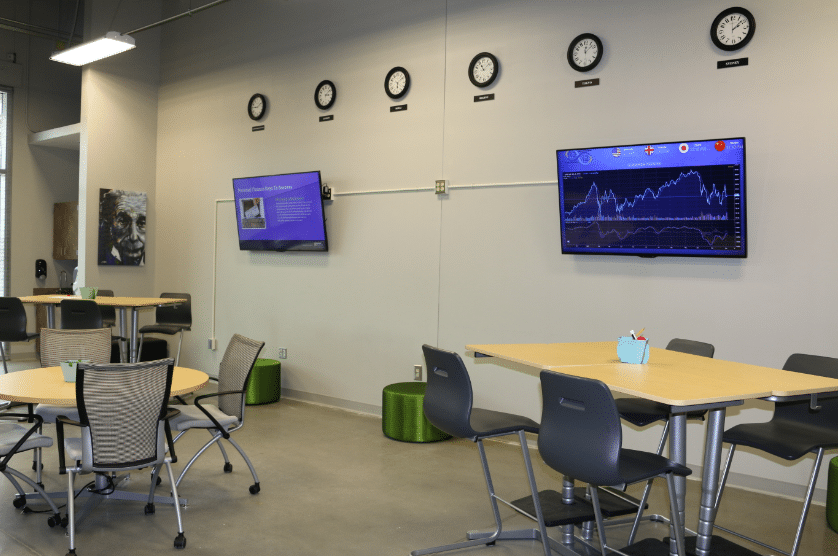
The Lab Space


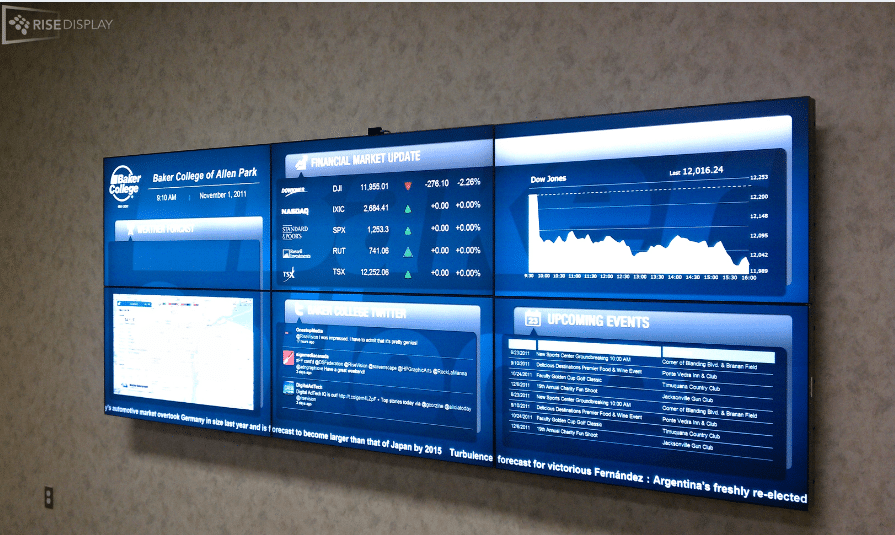
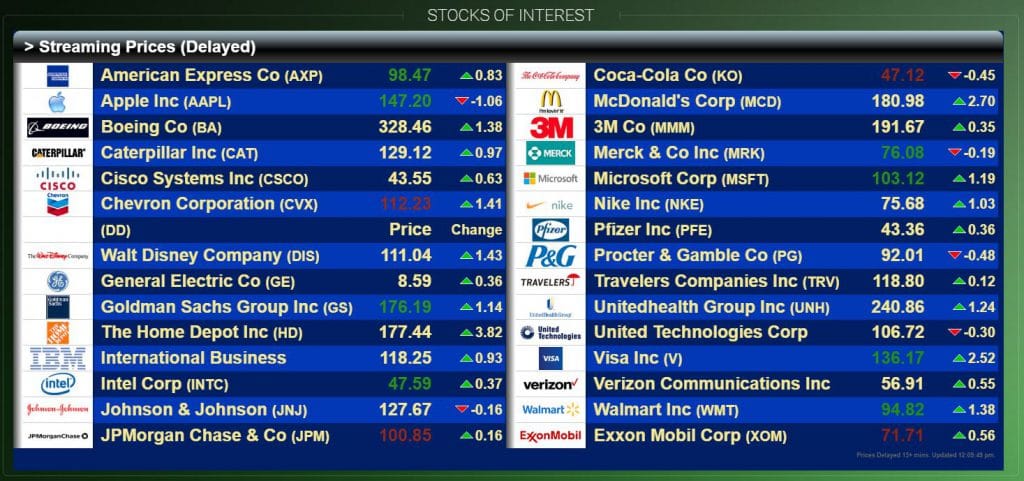
The Marquette lab is fitted with a wall-to-wall LED ticker along the ceiling, displaying 100 NASDAQ stocks. They also have a second smaller ticker displaying the time in some of the major markets from around the world that their Global Finance class focuses on – Chicago for futures and options, New York for American equities, London for European equities and futures, along with the Beijing and Sydney exchanges, all of which are available in the Personal Finance Lab trading platform.


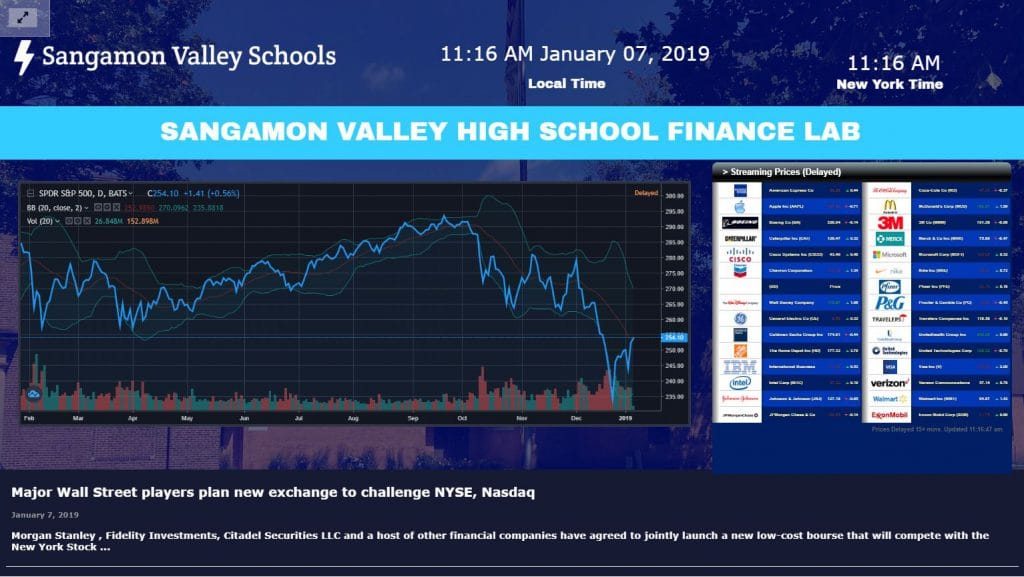
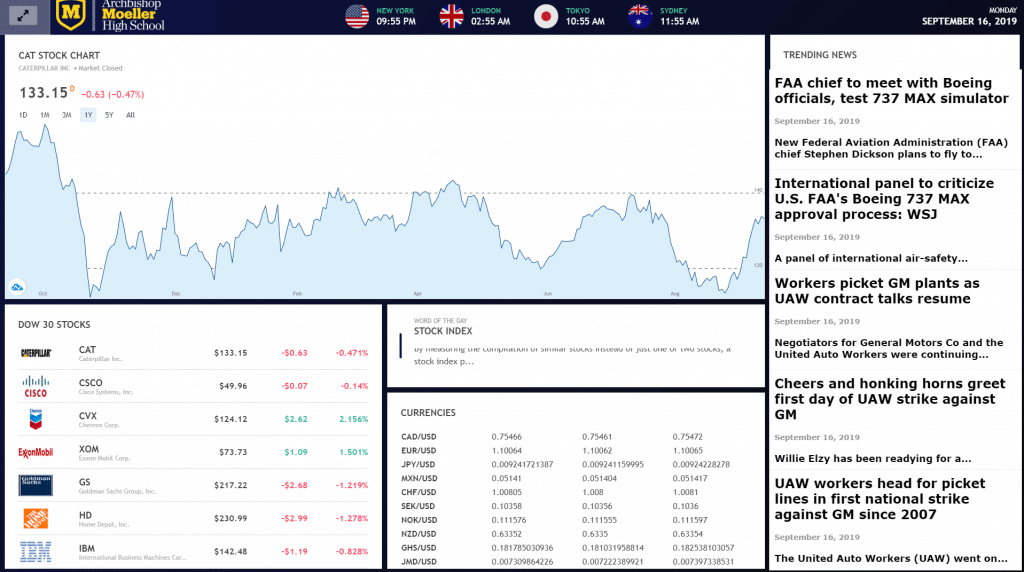
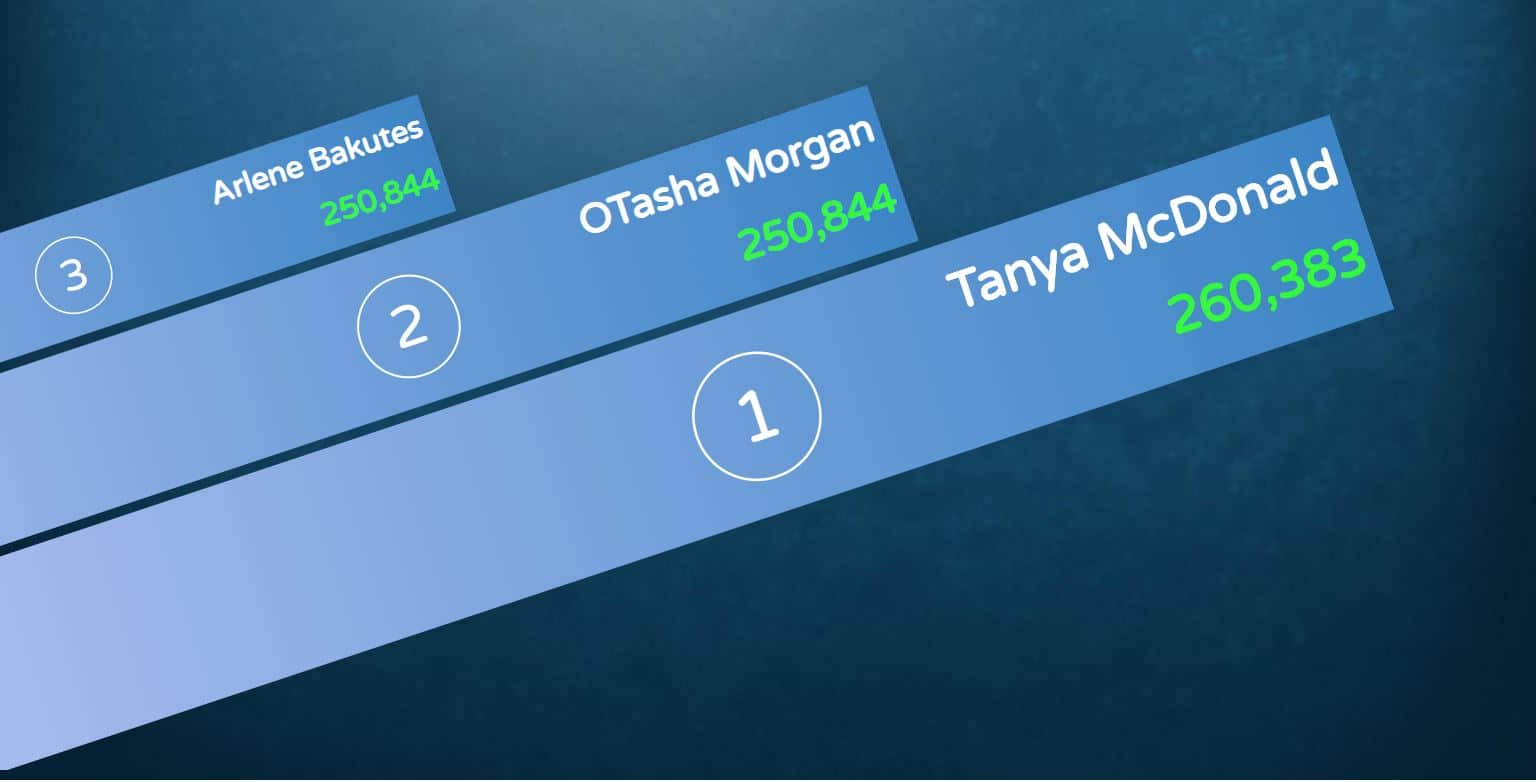
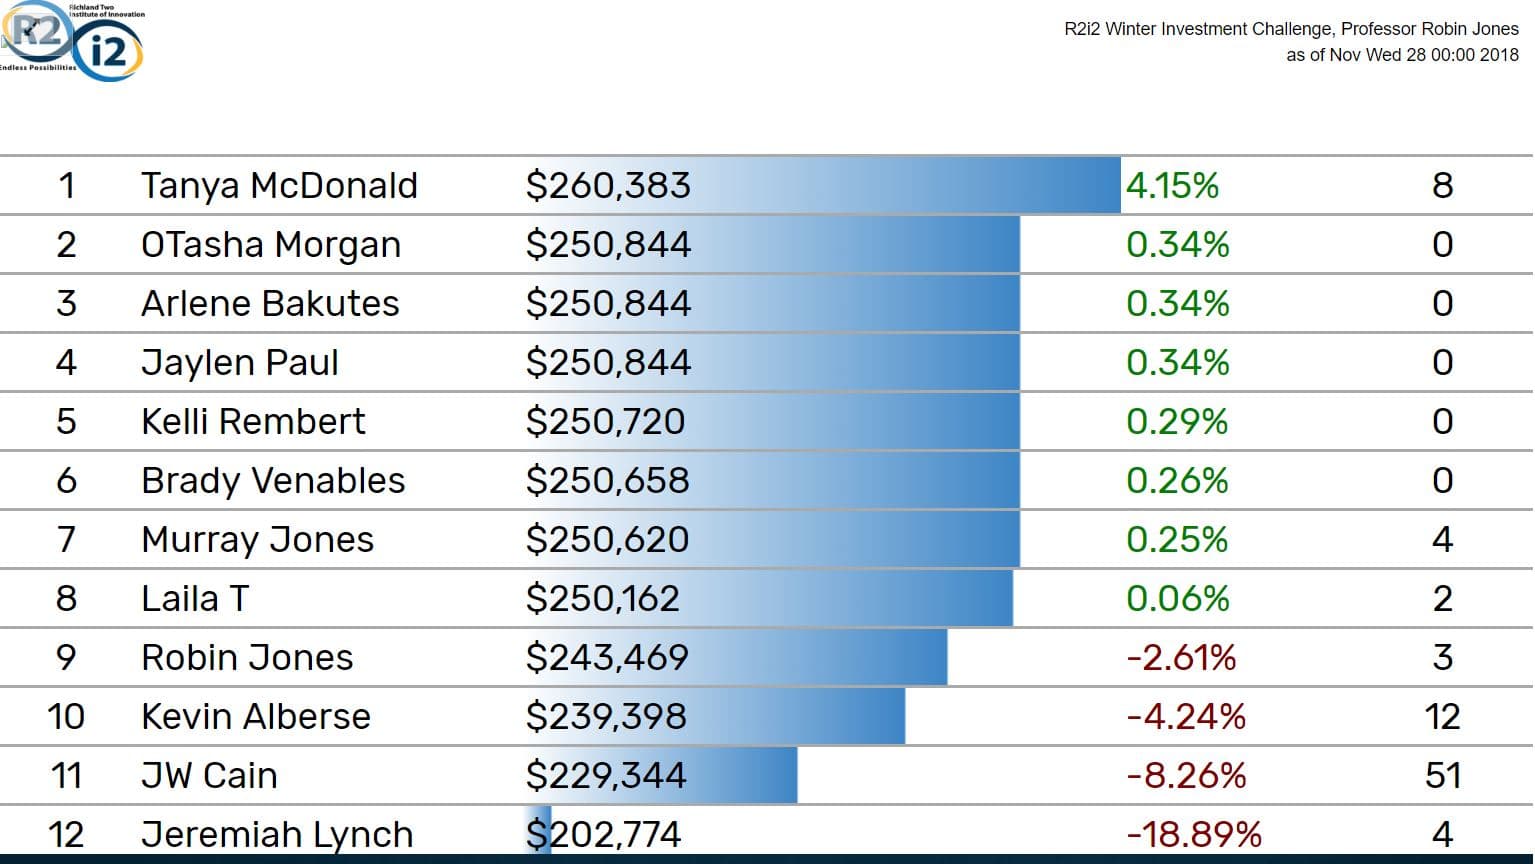
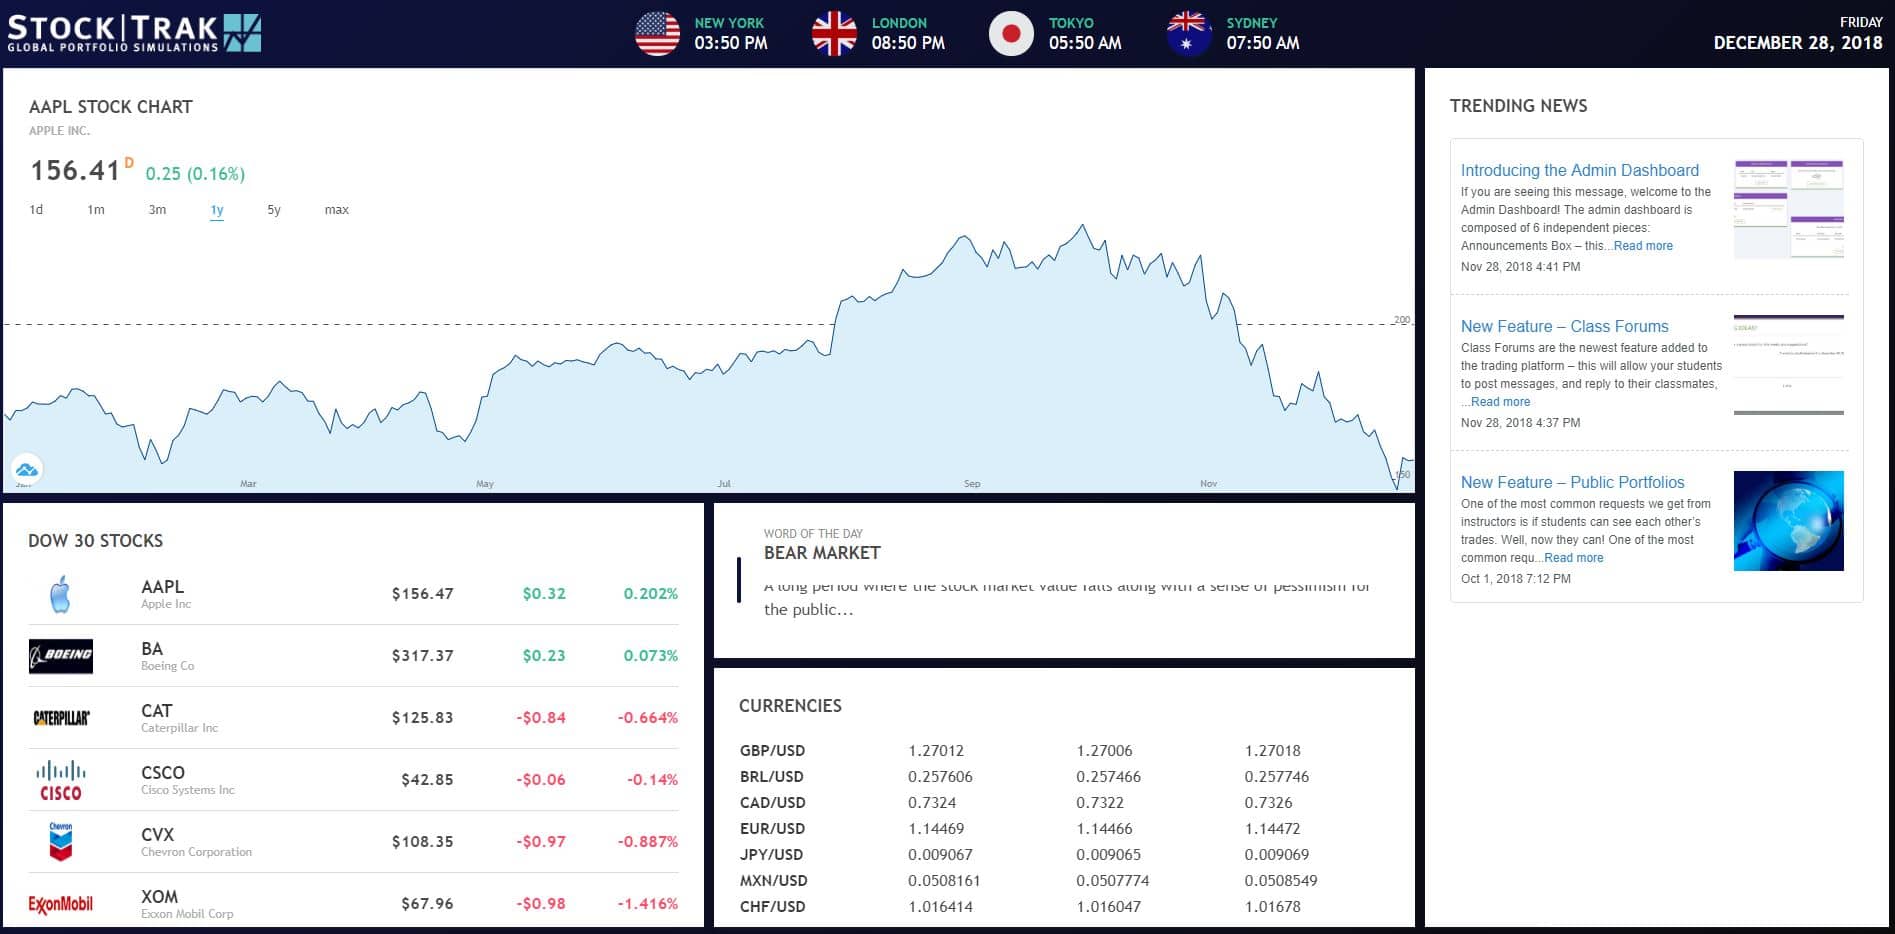
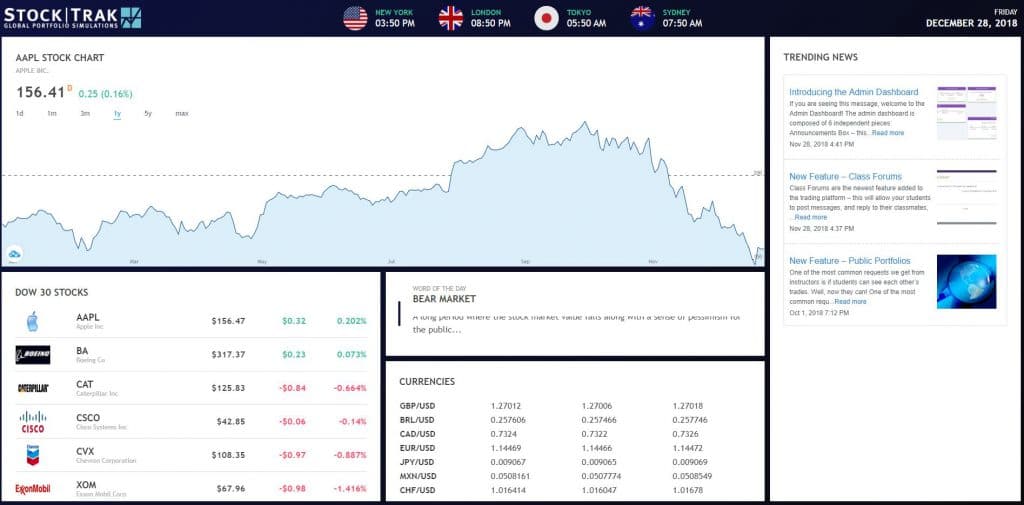
They also use two LCD displays, which alternate between live quotes for Forex and Commodities, a stock watchlist, live market news, live updating stock charts, and a streaming leaderboard of their class rankings (you can see more of what you can add to your displays on our blog post here). 

The Classes

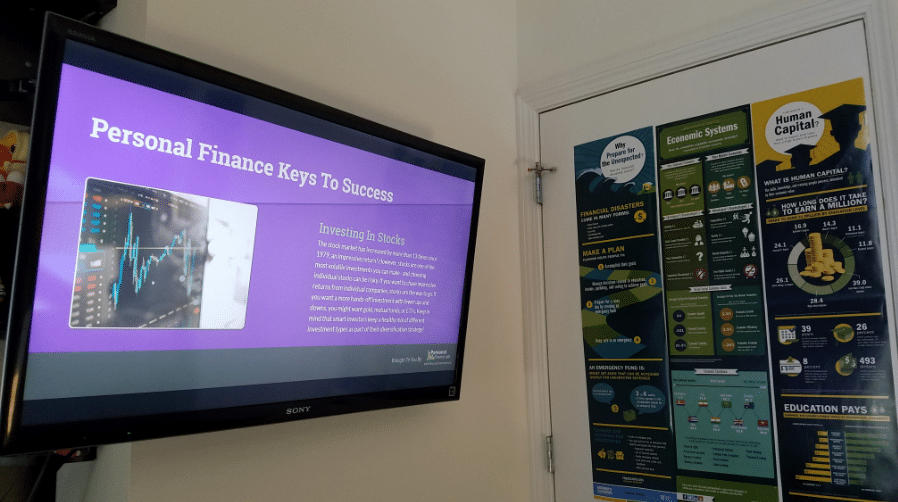
In the Lab itself, Marquette holds their Global Finance classes, Intro to Business classes, and Microsoft Office classes. The Intro to Business and Microsoft Office classes do not currently take advantage of the Personal Finance Lab website, but the streaming rankings are always a great discussion point, as they see their friends and classmates moving up the leaderboard.

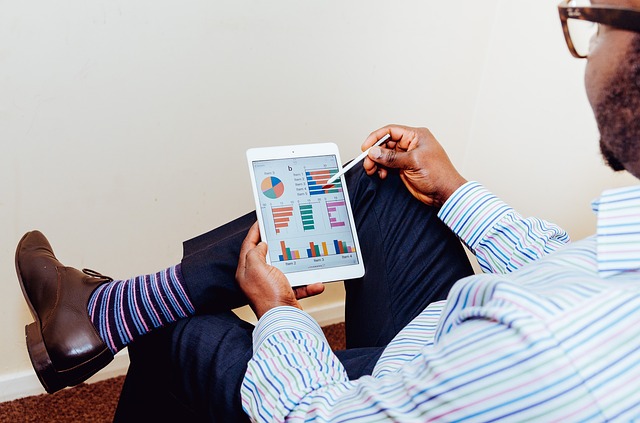
Marquette is a 1-to-1 iPad school – outside the lab space itself, they also use the PersonalFinanceLab website, curriculum, and simulation in their Economics classes. While these classes do not meet in the Lab itself, they are still able to utilize all the PersonalFinanceLab resources from anywhere with internet access – making it perfect even for homework assignments.

Over the last 12 months, the total usage of the PersonalFinanceLab website has increased from about 15 students a semester to over 60, as more teachers at the school find ways to incorporate the platform in their lesson plans.

Using Personal Finance Lab With The Global Trading Class

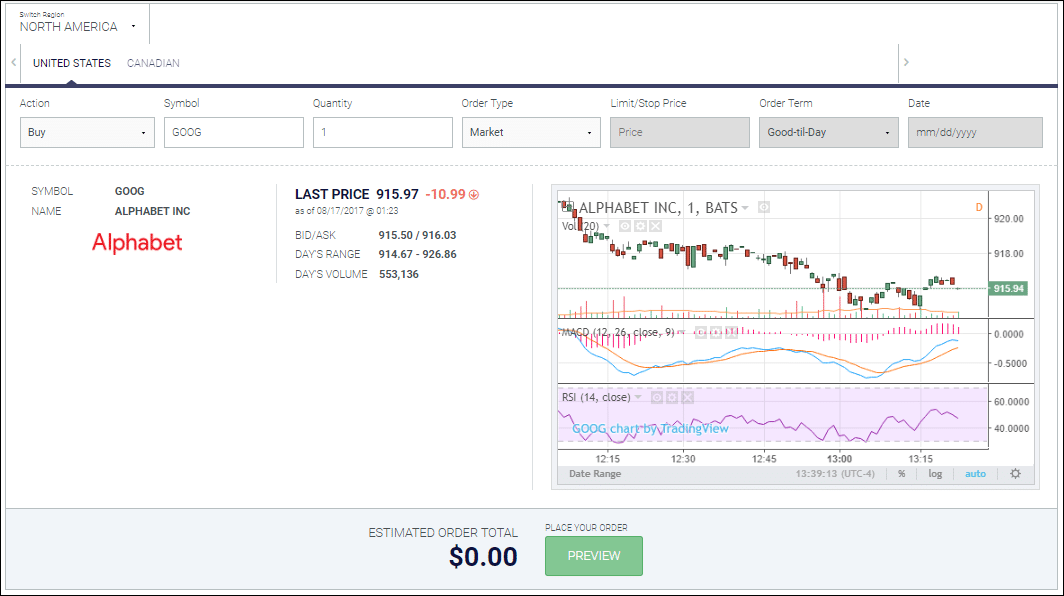
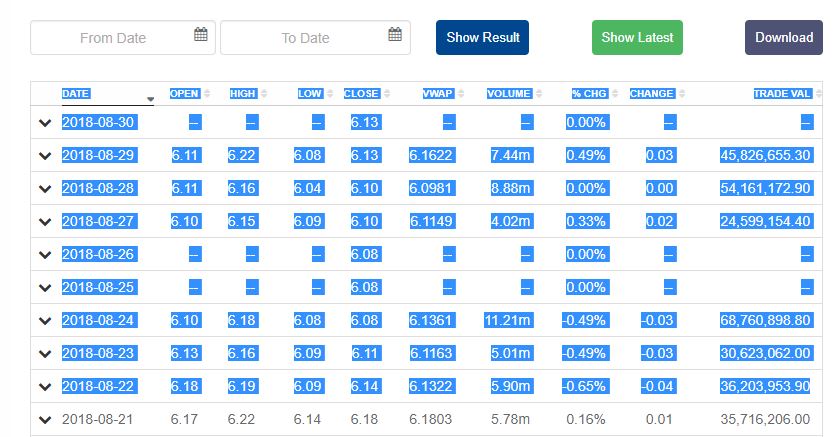
The Global Trading class was the first to utilize the stock game in their classes. This CTE-focused course has between 10 and 20 students a semester, with an emphasis on researching investments.


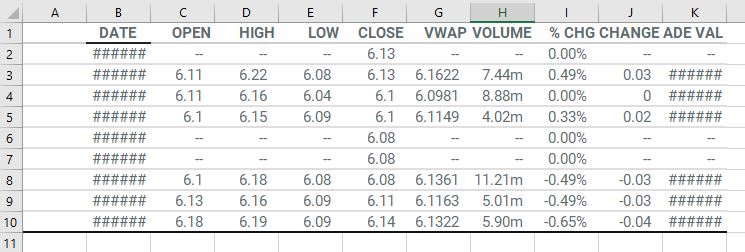
Snapshot of the Financial Statements Research tool


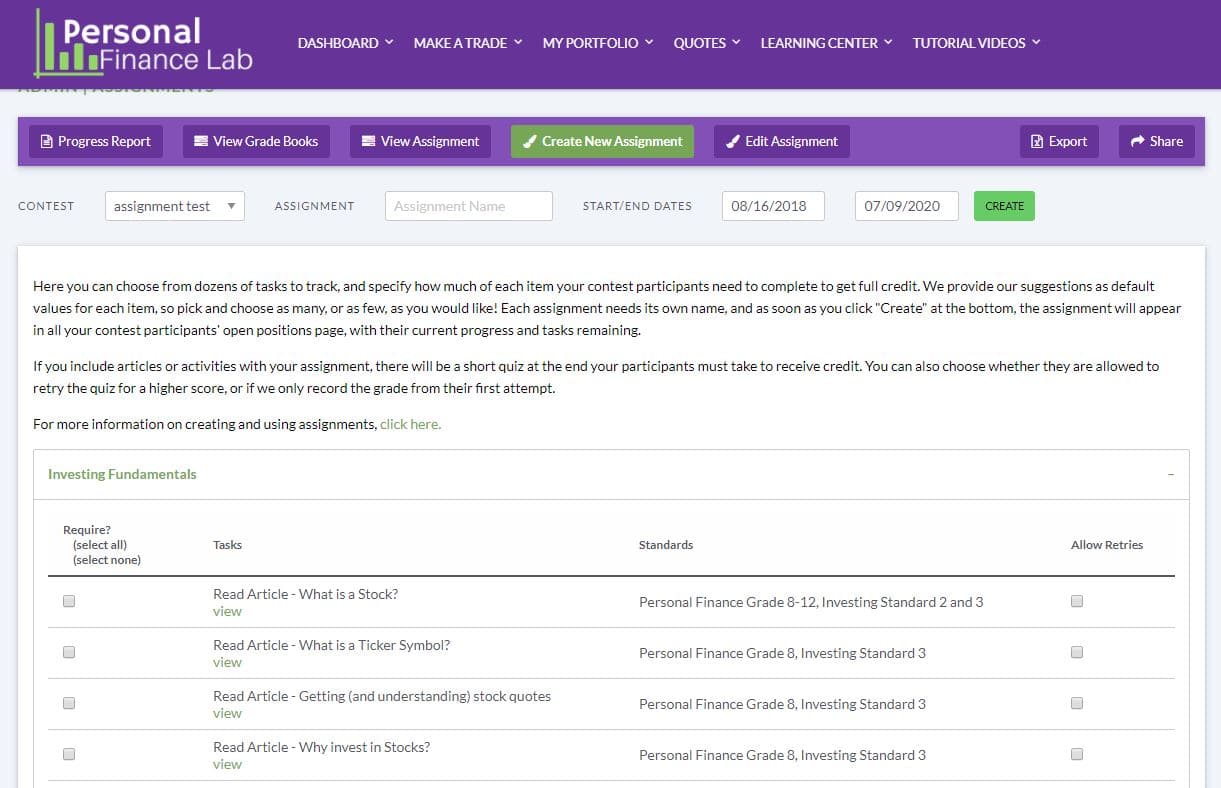
The class also utilizes the built-in Assignments feature to get students familiarized with investing and building a portfolio. Each week, students are given a new “Assignment”, borrowing both from the included stand-alone lessons, and integrated Investing 101 Beginner’s Investing Course.

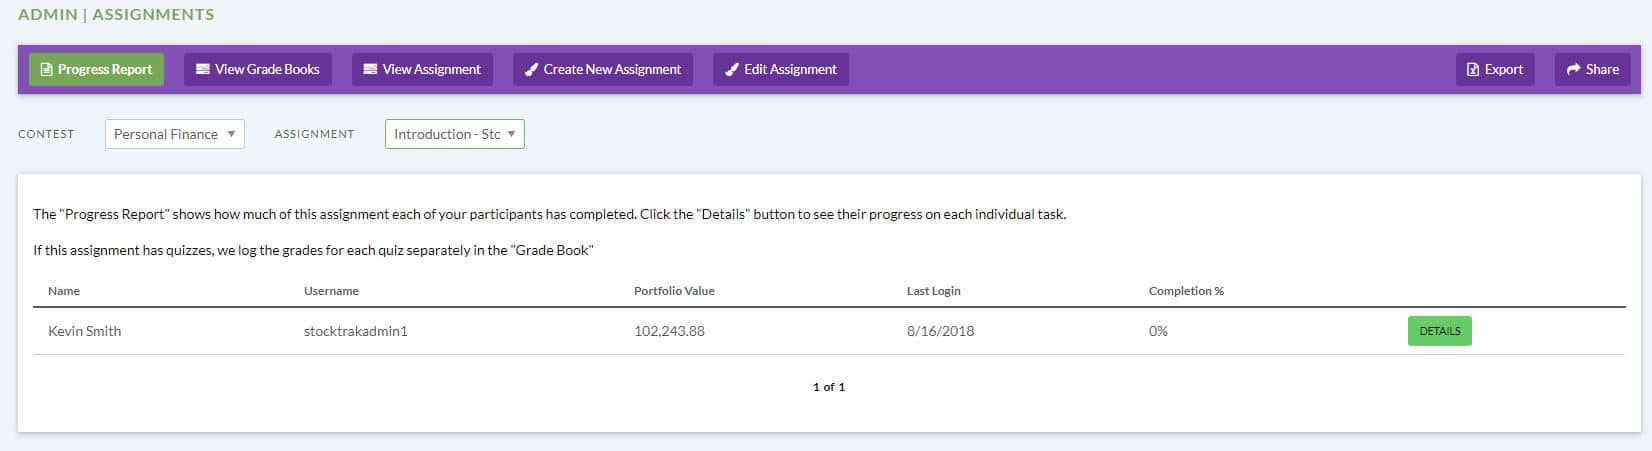
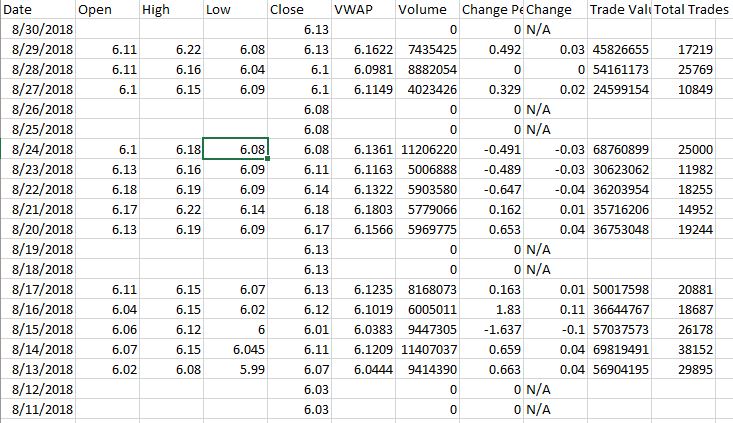
Snapshot of a student progress report – names obscured for privacy

So far, a group of 9 students this semester have placed over 550 trades between them (that’s over 60 trades each!), and we are barely through the midterms!

Since the Global Trading class meets in the Lab itself, the class rankings are broadcast to the LCD screens, and the students from other classes can monitor the standings of their friends – with a lot of interest getting generated to start a school Investing Club!

Using Personal Finance Lab With The Economics Class

Starting this semester, Marquette is also using the PersonalFinanceLab website in their Economics class. This class does not meet in the lab itself – students typically log in using their iPads elsewhere at school (or at home for homework). 

The economics class swaps intensive investing for more of a focus on the lessons and curriculum (the class of nearly 40 students have about 700 total trades). 

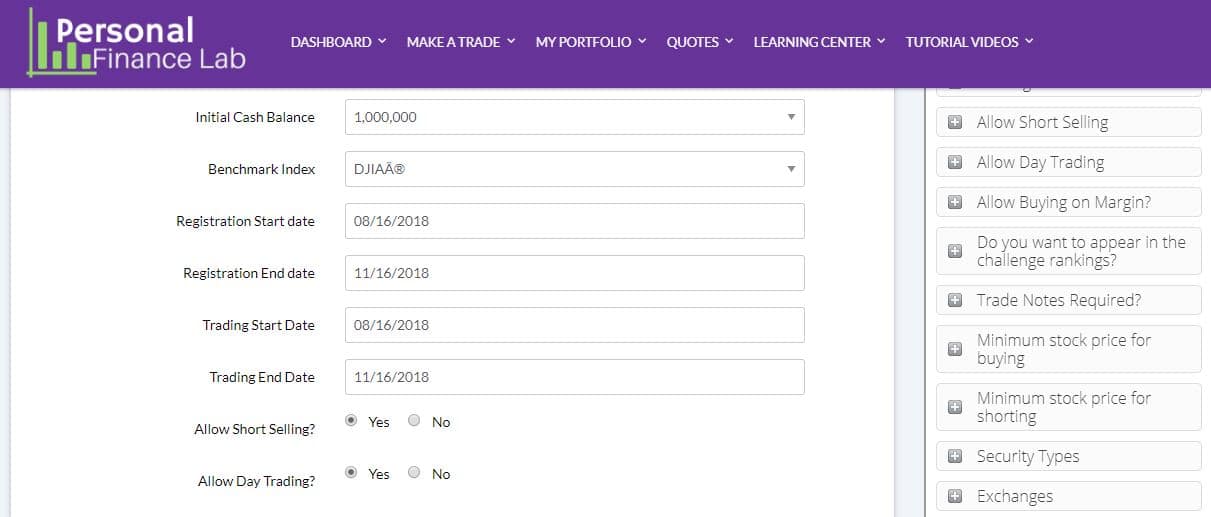
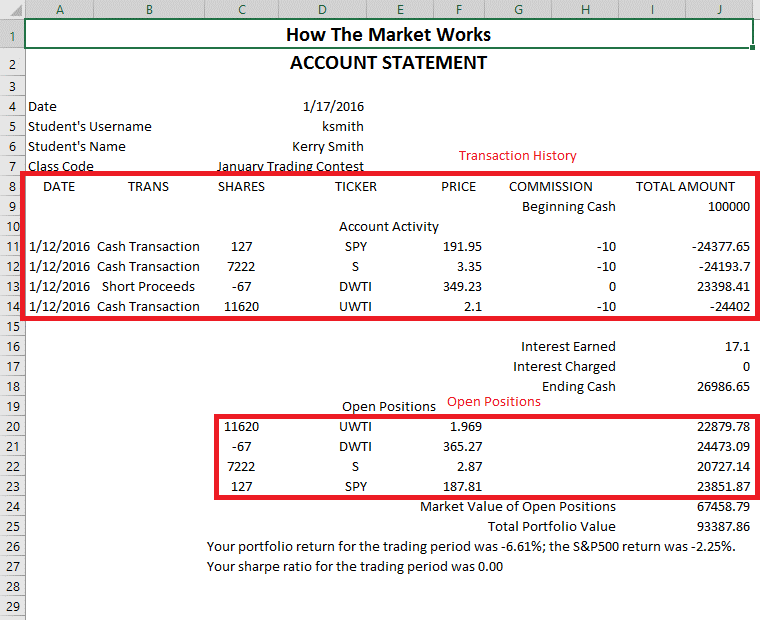
Snapshot of the Teacher Dashboard

The economics teacher structured the class Assignments to start small and work big – the first 2 weeks focus on stocks and investing (to get introduced to the concept of managing a portfolio) before adding in Economics and Personal Finance lessons, tailoring the week’s assignments to align with the topics covered in class. In all, there are 9 separate assignments, arranged week by week, with an average of 3 topics covered in each Assignment.

The addition of the Economics class greatly increased the reach of their Lab resources throughout the school, from a CTE-specific resource used by the business classes to an invaluable resource used by the social studies department as well (and a much wider audience of students).

Looking To The Future

Since launching the Lab, there has been a huge boost in interest for finance and investing across the school, and they hope to launch a new Investing Club later this year. Their new business teacher is also looking to use PersonalFinanceLab.com as a more active part of her lesson plans next semester.


If you are interested in getting more information, or ordering PersonalFinanceLab for your school, be sure to fill out the information request below!

[contact-form-7 id=”17211″ title=”Request More Information”]

We work with hundreds of schools around the country to take their Personal Finance, Economics, and Business classes to the next level. Over the last few years, more and more schools are using our Personal Budgeting Game, our customizable Stock Market Game, and our curriculum library to start building Finance Lab.  Eventually they add on the hardware (scrolling stock tickers and Wall Street-style LCD screens) to change their classroom into the most popular room at their school. 

No two schools are the same, and so every lab space is different. However, all successful labs have some combination of these elements – the PersonalFinanceLab.com site license which includes a Budget Game and a Stock Game, an LCD MarketBoard displays, scrolling LED tickers, and fun, educational posters. Here is what you need to know about each when planning out your successful lab:


PersonalFinanceLab.com License

The PersonalFinanceLab.com site license is the starting point for any Personal Finance, Business, or Economics class. This gives your classes access to the PersonalFinanceLab.com Personal Budgeting Game, our customizable Stock Market Game, curriculum, assessments, teacher reports, research tools, and Investing101 course.

The Budget Game, the Stock Game, and the curriculum are endlessly customizable, with plenty of quick-start settings to help you dive in. This will let you run your class stock contest (and keeping engaged in the class rankings), while students work through their Personal Finance, Economics, Accounting, or Business lessons that you choose each week. Each lesson ends with a quiz, and you can automatically add unit assessments to track overall progress (with plenty of reporting tools!) This is also the fastest and easiest part of your lab to launch – your classes can be up and running in as little as 24 hours – including a live webinar with the PFinLab team to help you get started.

Pricing

Individual/Student Accounts for less than 100 students

Single Class License

  • Covers: up to 60 students per year
  • Cost: $595 / year for either the Budget Game or the Stock Game
    • or $895 / year for BOTH the Budget Game and the Stock Game
  • Perfect For: Smaller schools with one or two teachers teaching financial literacy and business
  • Order Now  and pay with a credit card or request an invoice.

Micro Site License

  • Covers: up to 100 students per year
  • Cost: $995 / year for either the Budget Game or the Stock Game
    • or $1,495 / year for BOTH the Budget Game and the Stock Game
  • Perfect For: Smaller schools with one or two teachers teaching financial literacy and business
  • Order Now  and pay with a credit card or request an invoice.

Mini Site License

  • Covers: up to 250 students per year
  • Cost: $1995 / year for either the Budget Game or the Stock Game
    • or $2,995 / year for BOTH the Budget Game and the Stock Game
  • Perfect For: Medium schools with multiple economics, personal finance, and business classes
  • Order Now  and pay with a credit card or request an invoice.

Full Site License

  • Covers: up to 1,000 students / year
  • Cost: $3,995 / year
    • or $5,995 / year for BOTH the Budget Game and the Stock Game
  • Perfect For: Large schools with a focus on business and finance education, and schools that run school-wide investing challenges (Prizes are available)
  • Order Now  and pay with a credit card or request an invoice.

If you want to launch your lab quickly and cheaply this semester, you can’t go wrong with the Single Class license, and upgrade once more funds become available.

Learn More about the PersonalFinanceLab stock game and curriculum!


LCD “MarketInsight” Displays

The MarketInsight display is one of the fundamental pieces of any Finance Lab. This is an LCD screen that can rotate several financial “widgets” for your classes. The coolest part is that each MarketInsight is fully configurable – you choose what you want displayed! Click Here to see some options of what you can put on your MarketInsight Display.

There are two ways to upgrade to a MarketInsight – upgrade an existing TV, or order a commercial-grade screen.

MarketInsight Installation Tip:

MarketInsight draw a lot of attention – so keep this in mind when installing in your classroom! MarketInsight are best positioned at the sides or the rear of the room to avoid them becoming a distraction during instruction time.

Upgrading a TV

To upgrade a TV you already have at your school (or one you buy specifically for this purpose), you will need to order a $99 “Intel Stick”, which plugs into any HDMI port. This will connect to your school’s WiFi and the data feed to display your widgets. If you decide to upgrade a TV, remember to turn the screens off at the end of the day to avoid long-term screen burn.

Cost: $99 for each “Intel Stick”, plus $360/year for up to 3 screens for the data feed.

Commercial-Grade Display

Schools building a completely dedicated lab space may better be served by commercial-grade LCD display screens. These are typically a bit more expensive than a standard TV, but are designed to stay on for years at a time without any screen-burn. They are used both inside the classroom, as well as in the school hallways where they are expected to stay on regularly overnight. The purpose-built displays come with their own media players, so there is no need for an “Intel Stick” with this route.

Cost: A 48″ display costs about $1350, including shipping. Larger screens are slightly more expensive. This also requires a $360/year data feed, which covers up to 3 screens.


Scrolling LED Tickers

Finance Lab Scrolling Stock Ticker

Scrolling LED tickers are the crown jewel of any lab. These bring live market data into your classroom, making it the most exciting room at the school. If you do have an LED ticker, you will want to show it off – try to position it in the room so that it is visible from outside, but not at the very front of the class (to avoid it becoming a distraction).

In fact, many schools with LED tickers opt to either have windows on the classroom to make it completely visible from the hallway, or even install a second ticker in the hallway to grab the attention of passing students (and visiting parents). Tickers work best when you have drop-ceilings; they will need a standard power supply AND a hard-wire ethernet internet connection (they will not connect to your school’s WiFi)

See our gallery of recently-completed labs!

Cost: An 8-foot ticker costs about $5,200, 16-foot tickers cost about $10,000. Larger tickers are available in 4-foot increments. Each ticker also requires its own $499/year data feed.


Free Posters

Educational Personal Finance and Economics posters are an awesome way to spice up your classroom, and the first step in its transformation into a Finance Lab. Best of all, the best posters are free for schools thanks to the Federal Reserve in Atlanta!

There are over 15 different posters to choose from – pick which ones you like, and they will ship directly to your school, free of charge. These posters are a free (and super easy) way to “Set the mood” of your classroom – making it one of the fundamental building blocks of a Lab.

Click Here To Order Your Posters


Get More Information

Have more questions? Ready to launch your lab? Let us know and we’ll be happy to help!

The MarketInsight display is one of the fundamental pieces of any Finance Lab. This is an LCD screen that can rotate several financial “widgets” for your classes. The coolest part is that each MarketInsight is fully configurable – you choose what you want displayed!

PersonalFinanceLab classroom with screens

How Does It Work?

Think of your MarketInsight like a PowerPoint presentation that automatically cycles between slides. You can set any schedule you want – some widgets can be shown just for 30 seconds, while others are up for 2 hours. You can also schedule them differently per day – so you might want some widgets to only appear during certain class periods. However, most schools pick a few widgets on constant rotation, for a few minutes on each before cycling to the next.

The available widgets include:

The Market Wall

The “Market Wall” is customized with your school’s logo and colors, and includes a customizable watchlist, a live market chart showing market movement throughout the day, a market news feed, and a watchlist of the 30 biggest companies in the US markets.

Market Wall -Alternate Configuration With Rotating Watchlist

Ranking Widget

The Rankings Widget connects to your PersonalFinanceLab.com classes, and pulls the rankings to the display. This is configurable for different classes, and usually the part students get most excited about!

The Watchlist

The Watchlist is part of the Market Wall widget, but can also be used on its own. The Watchlist widget will let you pick any 30 stocks, and will constantly update the prices throughout the day. While the Dow 30 stocks are set by default, your classroom can also configure the list for whatever stocks your class wants to watch.

Words of the Day

Word of the Day widgets show glossary terms and concepts from different areas of financial literacy. There are few different “Sets” you can mix and match:

Digital Ticker

Each screen can also be enhanced by adding a customizable digital ticker to the top or bottom – perfect to keep live market updates regardless of other information!

Accounting “Word of the Day” with a digital ticker

Custom Screens

Custom screens can also be embedded – like school lunch menus, announcements, class web pages, and more!


To get a MarketInsight for your school, along with a site license for PersonalFinanceLab.com, you can request a quote here:

Cost is the biggest barrier preventing teachers from launching their first lab. Getting quotes from vendors, applying for grants, getting administration approval (on top of planning and running your classes!) puts up a huge wall between your students and the awesome financial literacy resources they deserve.

To help break down this barrier, we’ve put together the ideal “Starter Lab” – the core foundation of every lab that starts with one teacher in one classroom. Every finance lab builds on these foundations – so if you want to launch your Lab this semester, start with these basic elements!

Block 1: PersonalFinanceLab.com License

This is the basics of the basics – both the most important component of any lab, and the fastest to add to your classroom. A “Single Class” site license for PersonalFinanceLab.com covers up to 60 students per year (or 30 per semester) – just enough to launch your lab with a single class. For the first year of your lab, you might need to start small while the rest of the funding comes together, and expand the Lab resources to cover more classes.

We can set up your teacher logins for the PersonalFinanceLab.com platform (giving you complete access to the Budgeting Game, Stock Game, and curriculum library with over 300 self-grading lessons with build-in assessments), class rankings, and investment research tool suite) the same day your school issues a PO (or pays for the license by credit card), making it a fast and easy way to get your students the coolest tool in financial literacy education.

PersonalFinanceLab.com Single-Class Site License

  • Covers: 60 students/year
  • Cost: $895 / year
  • Perfect For: Small schools with small classes, or “Trial Runs” with a single class

PersonalFinanceLab.com Micro Site License

  • Covers: 100 students/year
  • Cost: $1,495 / year
  • Perfect For: Smaller schools with one or two teachers teaching financial literacy and business

PersonalFinanceLab.com Mini Site License

  • Covers: 250 students / year
  • Cost: $2995 / year
  • Perfect For: Medium schools with multiple economics, personal finance, and business classes

PersonalFinanceLab.com Individual Accounts

  • Cost: $15 / Student
  • Perfect For: Smaller schools and pilot programs

If you want to launch your lab quickly and cheaply this semester, you can’t go wrong with the Single Class license, and upgrade once more funds become available.

Learn More about the PersonalFinanceLab budget game, stock game and curriculum!

Or Order Now!


Block 2: Educational Posters

Educational Personal Finance and Economics posters are an awesome way to spice up your classroom, and the first step in its transformation into a Finance Lab. Best of all, the best posters are free for schools thanks to the Federal Reserve in Atlanta!

There are over 15 different posters to choose from – pick which ones you like, and they will ship directly to your school, free of charge. These posters are a free (and super easy) way to “Set the mood” of your classroom – making it one of the fundamental building blocks of a Lab.

Click Here To Order Your Posters


Block 3: Transform A TV Into A MarketBoard

The biggest eye-catching pieces of any Lab is the hardware. This is what really brings the room to life, turning an old classroom into the most popular room at your school.

A “MarketBoard” display is a screen in your room that cycles between several “Widgets”, including Financial News, Glossary “Terms of the Day”, Quotes and Charts from the stock markets, and the class rankings from the investing simulation (part of PersonalFinanceLab.com).

Many schools with large grants available will order multiple purpose-built display screens, along with LED tickers. However, to get your lab set up quickly (and cost-effectively), you can also use an existing TV at your school, and upgrade it into a MarketBoard with a simple add-on that plugs into any HDMI port.

Upgrading your existing TV into a MarketBoard just needs the add-on stick ($99 on Amazon), plus a $360 / year Financial Widget pack (this pack covers up to 3 screens, which makes it easy to upgrade your lab as more funds become available).

Cost to upgrade your TV: $99 add-on + $360 / year Widget Bundle = $459 total

Set-Up Time: 3-5 Business Days for the add-on to arrive, plus time for your school to install the screen at your school

Click Here To Get A Quote


Putting It All Together

All in, you can launch your Lab in less than 2 weeks for 60 students for an all-in cost of $1,255 –  one of the best investments your school can make!

Request More Information

[contact-form-7 id=”17211″]

Comparative Advantage is the concept where one person, business, or economy is able to outproduce one particular product or service compared to another person, business, or economy.

The concept of comparative advantage is essential to understanding both why people choose different careers, and why countries engage in international trade.

Comparative Advantage At The Personal Level

When it comes to people, comparative advantage will have a large role in determining jobs and income. There are two main types of comparative advantage – Natural, and Acquired.

Natural Comparative Advantage

Corn
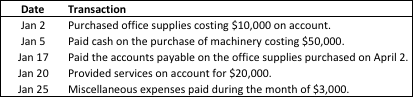
Imagine two farmers – Alice and Bob. Alice and Bob both have farms located 15 miles away from a major city, and both have about the same quality of soil. If they both grow corn in the same year, they will produce about the same amount, and earn the same income. In this example, neither Alice nor Bob has any comparative advantage.

However, there are a few things that can change this, including Distance, Quality, and Aptitude:

Distance

If Alice’s farm was actually 30 miles away from the city, it would mean she would need to travel 20 more miles than Bob to get her produce to market. That adds an extra cost – even if she works just as hard and produces the same amount of corn, she will have a lower income than Bob just because of the distance.

Quality

If the soil in Alice’s farm is a lot rockier and less fertile, she will end up producing less corn with the same amount of work as Bob.

Aptitude

If Alice is not as fast a planter as Bob, it will also mean she will produce less corn with the same amount of work. For comparative advantage, “Aptitude” is something you are born with, not something you can acquire later with training.

Acquired Comparative Advantage

Natural comparative advantage is outside someone’s control, but acquired comparative advantage is something that will change over time.

Skill

If Alice goes to school or focuses on honing her farming skills, she might become a better planter, or more efficient with her inputs. This will give her a comparative advantage over Bob.

Capital

capitalIf Alice always re-invests half of her income into her business, but Bob does not, within a few years Alice’s machines and tools will be a lot more up-to-date and productive than Bob’s.

Personal Comparative Advantage and Careers

All of these factors also come into play when choosing jobs and careers. You might have a lot of aptitude at a job you don’t like – this means that you might have a comparative advantage at the beginning of someone else, but that person could easily surpass you with training and dedication. At the end of the day, your income and job satisfaction will come from both your natural comparative advantages and your acquired ones. Doing something you enjoy, while constantly working to improve your skills, is a good way to secure growing income (so long as what you choose to do has value on the markets – someone will still need to pay you!).

National Comparative Advantage

The same factors that impact a person’s comparative advantage also applies to countries. An easy example is oil, which constantly trades between countries all over the world.

Distance: The United States imports oil from Saudi Arabia to the East Coast, but also exports oil to Japan from Alaska. This is because it is cheaper to bring oil from Saudi Arabia to the East Coast across the ocean than it would be to bring it by pipeline from Alaska. At the same time, the Alaskan oil fields are relatively close to Japan, making it cheap to export.

Quality: Japan has almost no oil in their own soil, so if they wanted to produce any themselves, they would need expensive offshore oil drilling platforms (and still would not have enough). They can instead buy oil from the United States far cheaper than they can produce it themselves, since the US can produce it relatively cheaply from Alaskan oil fields.

Aptitude: The United States has a much higher population than Japan, meaning we need to put a much smaller percentage of our workforce into oil production. This means it is fairly easy for the United States to have a large number of well-trained petroleum engineers, while Japan would need to take engineers away from other fields to work on oil research.

Skill: Japan tends to focus its research and development on technology and energy efficiency, and not on oil production. Saudi Arabia is rich in oil, so to best exploit this natural resource, they train many engineers and researchers to work with petroleum. This means Japan is more likely to produce computer chips and medical technologies that it trades for oil, while Saudi Arabia is more likely to produce oil that it trades for computer chips and medical technologies.

Capital: Japan has been investing heavily in its own infrastructure over the last 100 years in an effort to rapidly industrialize. This means that Japan has a lot of advanced technology in many fields, so it can compete on a global scale in a large number of industries. Saudi Arabia has been rapidly industrializing only over the last 40 years, continually re-investing its profits from oil into expanding their economy. This means that their economy is very dependent on the oil trade (and sensitive to the change in price of oil), while Japan does not rely on any one particular industry.

Specialization

Countries will choose what to produce themselves, and what to trade, based on their comparative advantages relative to the rest of the world’s economy. This means that by trading with other countries, both trading partners usually benefit. With our oil example:

Japan starts off by needing to import oil. It can import from Saudi Arabia or the United States. Both sellers are offering the same price, but the Saudi Arabian oil is farther away than the Alaskan oil, making it more expensive. This causes Japan to decide to import its oil from the United States.

The United States drills its oil in Alaska, but needs its oil in New York. It could send it to New York by pipeline, but the cost of building and maintaining that pipeline is more expensive than the transport cost of bringing in oil from Saudi Arabia. This causes the United States to import oil used on the East Cost from Saudi Arabia, while selling the oil it drilled in Alaska to Japan.

Saudi Arabia wants to buy computers from Japan, but Japan does not want anything from Saudi Arabia. So instead, Saudi Arabia sells its oil to the United States to get US dollars. Meanwhile, Japan wants to buy oil from the United States, so it is happy to trade its computers to Saudi Arabia to get their US dollars, completing the cycle. Everyone gets better off, thanks to the trade!

cycle

Schedule a call

Get PersonalFinanceLab

This lesson is part of the PersonalFinanceLab curriculum library. Schools with a PersonalFinanceLab.com site license can get this lesson, plus our full library of 300 others, along with our budgeting game, stock game, and automatically-graded assessments for their classroom - complete with LMS integration and rostering support!

Learn More

[qsm quiz=194]


Graphing is one of the most important features of spreadsheets. When you need to present your findings, whether as a written report or a presentation, summarizing your data in graphs is the best way to quickly communicate large amounts of data.

This guide will walk through taking your raw portfolio data, making some simple calculations, and transforming the data into graphs that you can include in reports.

Line Graphs

Your Daily Portfolio Value

First, we want to make a line graph showing our daily portfolio value. Open your spreadsheet that has your daily portfolio values, it should look something like this:

portfolio values

Portfolio values are calculated at the end of the day when the market is closed and all your assets (Stocks and Mutual Funds strictly on this site) are summed together which shows your ending portfolio value.

To insert a basic line chart of your portfolio data, highlight your data and click “Insert” in the Office Ribbon, or “Charts” in Google Sheets:

highlight data

And that is it! Your new chart is ready for display. You can even copy the chart and paste it in to Microsoft Word (if using Excel) or a Google Doc (if using Google Sheets) to make it part of a document, or paste it into an image editor to save it as an image to be used for any reports you might have it to use.

portfolio value chart

Microsoft Excel

sheets graph

Google Sheets

Portfolio Percent Changes

Next, we want to make a graph showing how much our portfolio has changed every day since the tournament has began. To do this, first we need to calculate the daily % change, instead of just our raw portfolio value.

Basic Calculations – Using Formulas

In the next column we will calculate our daily portfolio percentage change. First, in the next column, add the header “% Change”.

new column heading

Now we need to make our calculation. To calculate the percent change each day, we want to take the difference between the most recent day’s value minus the day before, then divide that by the value of the day before.

Percentage Change = (Day 2’s Value – Day 1’s Value) / Day 1’s Value

To do this, in cell C3 we can do some operations to make the calculation for percentage change. To enter a formula, start by typing “=”. You can use the same symbols you use when writing on paper to write your formulas, but instead of writing each number, you can just select the cells.

To calculate the percent change we saw between day 1 and day 2, use the formula above in the C3 cell. It should look like this:

Now click on the bottom right corner of that cell and drag it to your last row with data, Excel will automatically copy the formula for each cell:

percent change 3

You now have your percentages! If you want them to display as percentages instead of whole numbers, click on “C” to select the entire column, then click the small percentage sign in the tools at the top of the page:

percent change 4

Selecting Certain Columns For Your Graph

Now we want to make a graph showing how our portfolio was changing each day, but if we try to do the same thing as before (selecting all the data and inserting a “Line Chart”, the graph doesn’t tell us very much:

This is because it is trying to show both the total portfolio value and the percentage change at the same time, but they are on a completely different scale!

To correct this, we need to change what data is showing. If you are using Excel, right click on your graph and click “Select Data”:

select data

This is how we decide what data is showing in the graph. Items on the left side will make our lines, items on the right will make up the items that appear on the X axis (in this case, our Dates).

Uncheck “Portfolio Value”, then click OK to update your graph:

bad axis

For Google Sheets, this is done similarly, right click on your graph and select “Data Range” (the letters for this example will be the same as Excel, C2:C6)

This is closer to what we’re looking for, but the axis labels (the dates) are right in the middle of the graph, making it hard to read.

Formatting Your Line Graph

Now we want to move the dates to the bottom of the graph (here they are along the “0” point of the Y axis).

To do this in Excel, right-click on the dates and select “Format Axis”:

excel format

A new menu will appear on the right side of the screen. Here, click “Labels”, then set the Label Position to “Low”.

formatting 2

The method is similar on Google Sheets as well, start by selecting “Axis” then “Horizontal” or “Vertical” Axis to edit them.

With this feature you change the axis titles and add different features to it.

sheets format

Congratulations, your graph is now finished! You can now easily see which days your portfolio was doing great, and which days you made your losses.

Bar Charts and Pie Charts – Your Open Positions

Next we would like to make a bar chart showing how much of our current open positions is in each stock, ETF, or Mutual Fund.

Directions for Excel

First, open your spreadsheet with your Open Positions. It should look something like this:

b1

Since we want to make a bar chart, we can only have two columns of data – one for the X axis, and one for the Y axis of our chart.

We want one column showing the symbol, and a second column showing how much it is worth. The “Total Cost” column is the current market value of these stocks, so that is the one we want to keep. However, we don’t want to delete the quantity and price, since we might want it later. Instead, select the columns you don’t want, and right-click their letter (A and C in this case). Then, select “Hide”.

b2

Now the columns that we don’t want in our chart are hidden. We can always get them back later by going to “Format” -> “Visiblity” -> “Unhide Columns”.

Now select your data and insert a “Bar Chart” instead of a “Line Chart”:

b3

Before you’re finished, your chart will say “Total Cost”. You can change this by clicking on “Total Cost” and editing to say whatever you would like (like “Portfolio Allocation”).

b4

This graph is now finished, but you can also try changing the Chart Type to try to get a Pie Chart.

Switching Chart Types

Sometimes, our first chart type is not the best way to display our data. For example, a bar chart will show me how much of each symbol I am holding. A better choice might be a pie chart, which will show how much each symbol is as a percentage of my total holdings.

To change our bar chart to a pie chart, right click your graph and select “Change Chart Type”:

b5

Next, find the “Pie” charts, and pick whichever chart you like the best.

b6

Last, now we don’t know which piece of the pie represents which stock. To add this information, click your pie chart, then at the top of the page click “Design”. Then select any of the options to change how your pie chart looks.

b7

Congratulations, you’ve converted your bar chart into a pie chart! This one should look almost the same as the one you have on the right side of your Open Positions page. You can now copy and paste these charts directly into your Word document, or save it as an image to use elsewhere.

Directions for Google Sheets

To create a Bar Graph, select “Insert” then “Chart”, the same as we did for our previous line charts.

b9

When clicking this, one of the options in “Chart Editor”, will be “Chart Type”, there you can select the bar graph or pie chart.

b10

In this section you will also need your Data Range, which will be the same as the previous example (Symbol and Total Cost). To edit the axis and other information, is the same method as the previous type.

b11

The pie chart will look very similar to that on your Open Positions Page as well!

b12

Schedule a call

Get PersonalFinanceLab

This lesson is part of the PersonalFinanceLab curriculum library. Schools with a PersonalFinanceLab.com site license can get this lesson, plus our full library of 300 others, along with our budgeting game, stock game, and automatically-graded assessments for their classroom - complete with LMS integration and rostering support!

Learn More

[qsm quiz=193]

The most important reason you would want to use excel to track your stock portfolio is trying to calculate your profit and loss from each trade. To do this, open the spreadsheet with your transaction history. It should look something like this:

profit 1

Tip: If you have not bought and then sold a stock, you can’t calculate how much profit you’ve made on the trade.

Simple Calculations

First, we want to change how the data is sorted so we can group all the trades of the same symbol together. Use the “Sort” tool to sort first by “Ticker”, next by “Date” (oldest to newest).

trans calc 2

For DWTI and SPY, we haven’t ever “closed” our positions (selling a stock you bought, or covering a stock you short), so we cannot calculate a profit or loss. For now, hide those rows.

trans calc 3

Now we’re ready to calculate! Lets start with the trade for S. This one is easy because the shares I sold equal the shares I bought. This means if we just add the “Total Amount”, it will tell us the exact profit or loss we made on the trade.

cost 3

This does not work for UWTI, because I sold a different number of shares than I bought. This means that I need to first calculate the total cost of the shares I sold, then I can use that to determine my profit.

Different Buy/Sell Calculations

First: multiply your purchase price times the number of shares you sold:

trans calc 5

Second: add this number to the “Total Amount” from when you sold your shares.

trans calc 6

Now you have your profit or loss for this trade. Note: this is the method for if you bought more shares than you sold – if you bought shares at different prices, then sell them later, you’ll need to calculate your Average Cost to use in your calculation.

Average Cost Calculations

To calculate this, lets use the same example of UWTI shares and delete the rows of the S shares. Suppose we bought 11,620 shares on January 12th, as we did above, but also bought 6000 shares on January 15th for a different price at $2.5 per share. To calculate our profit or loss we would first have to calculate the Average Cost of the shares we bought. To do this, we need to add our total amounts for both purchases and divide that value by the total number of shares we bought. The calculation for this would be (24402+15000)/ (11620+6000), which would give us a value of $2.24. We can easily create a function on Excel or Google Sheets to calculate this for us. In this case, our function would be “=(G2+G3)/(C2+C3)” which should look something like this on Excel or Google Sheets:

calculating cost


Next, we subtract this Average Cost from the Average Sale price of $1.9 and multiply the value we get by the number of shares we sold. This will then give us our profit and loss for the trade. We will have to create another function for this onto cell G10. However, since our average cost value is already negative, we would add it on our function instead of subtracting. Our function should be “=(E4+G7) *-C4” which should give us a value of $-1681.04 (Loss). We also put a negative sign in front of our C4 value to represent a sale. Our final spreadsheet should look something like this:

profit or loss

Schedule a call

Get PersonalFinanceLab

This lesson is part of the PersonalFinanceLab curriculum library. Schools with a PersonalFinanceLab.com site license can get this lesson, plus our full library of 300 others, along with our budgeting game, stock game, and automatically-graded assessments for their classroom - complete with LMS integration and rostering support!

Learn More

[qsm quiz=192]

If you’ve been trading for a long period of time you might have been curious to know what your daily returns were. Excel and Google Sheets can help you efficiently calculate this in a simple way. Suppose we started trading on August 29th, 2017. It is now September 7th and we would like to know our daily returns for our portfolio. First, we would look up our Historical portfolio values by going to our Dashboard, and clicking “View Historical Portfolio Values” next to our Portfolio Value Chart:


Once there, simply click on Historical Portfolio Values and a new window will pop up displaying the data. The page should look something like this:

You can either click the “Export” button to download this as a spreadsheet, or copy the data into your spreadsheet.

As mentioned in our Getting Some Data article, values may sometimes appear as “#####”. To fix this, you simply need to adjust the column widths.

Next, we add a heading for Daily Returns under column “C”. We can then create a function on Excel or Google Sheets to calculate each days’ return for us in dollars. Since we only started trading on August 29th, we wouldn’t have any returns for that day and we can leave that cell blank. Instead, we would write the function onto the second cell under the column, cell C3, and drag it downwards from the bottom right of the cell to copy it onto the rest of the column. The function we would input is “=(B3-B2)”. It should look something like this on your Google spreadsheet or Excel:

The values we have calculated here are our daily returns in dollar amounts. If we wish, we can also find these amounts as a percentage. To do this, we would create another heading on column D and name it “Daily Returns %”. Then, we would click on the second cell under this column (Cell D3) and input the function “=(C3/B2) *100”. This should give us a value of 0.009%. To repeat this for the other dates, simply drag the 0.009% value downwards the same way we did for the dollar value. Google Sheets/Excel will then calculate the remaining values for us.  We have now calculated our daily returns in a dollar amount and as a percentage. The final spreadsheet should look something like this:


Schedule a call

Get PersonalFinanceLab

This lesson is part of the PersonalFinanceLab curriculum library. Schools with a PersonalFinanceLab.com site license can get this lesson, plus our full library of 300 others, along with our budgeting game, stock game, and automatically-graded assessments for their classroom - complete with LMS integration and rostering support!

Learn More

[qsm quiz=195]

The first step in using any spreadsheet is getting some data! This tutorial will show you different ways to import some of your portfolio data into a spreadsheet and how to format it to make it easier to read.


Getting Data

The first step to using any spreadsheet is getting some data – once we have our data in our sheet, we will then start formatting it to make it easier to use.

Copy/Paste Method

The easiest way to import data is to just copy and paste it from a website or another source.

Getting Your Historical Portfolio Values

To get your old portfolio values, you can copy and paste them out of the Personal Finance Lab website. You can find these on the “Dashboard” page, next to your portfolio graph.

pfin values

This will open up a small window showing what your portfolio value was for every day of the contest. Highlight the information you want, then right click and “Copy”.

portfolio value

Next, open a new blank spreadsheet and click cell A1. You can then right-click and “Paste” the data in. The column headings should be included too.

Adding Column Headings

If the column headings are not included, right-click the first row and select “Insert Row”. This will add a new row to the top of the spreadsheet where you can type in the column names. Google sheets gives you the option to add a row above or below the one you right clicked.

column headings

Now “Save” your file somewhere you can easily find it later, you’ve got some data!

Getting Historical Prices for Stocks

For this example, we want to get the historical prices for a stock, so we can look at how the price has been moving over time. First, create a new blank spreadsheet in Excel or Google Sheets. We will use Sprint stock (symbol: S). Go to the quotes page and search for S, then click “Price History” on the right side of the page:

s history


Next, change the “Start” and “End” dates to the time you want to look at. Once you load the historical prices, highlight everything from “Date” to the last number under “Adj. Close” (it should look like this):

price highlight

Now copy the data, select cell A1 in your blank spreadsheet, and paste.

Congratulations, we have now imported some data into our spreadsheet! You can now save it for future use. The data is a bit messy; we will look at formatting later.

Export Method

Sometimes, websites will make it easy for you to export data directly to your spreadsheet without copy/paste. If an export option is available, this is going to work better, since it will require less formatting later.

If we look back at the Historical Prices, you can see that there is also a “Download” button at the top of the table:


download button


This will download a spreadsheet you can just open directly – you can also see the data is already easier to read and better formatted, which will save us time later.


price export


Copying Between Spreadsheets

You can also export your portfolio data from most places on the site, but for this example we will use the full Account Export from the My Contests page. This will download one big spreadsheet showing your account balances, trades, open positions, and more.

For each individual report, you can also use the “Export” button at the top of every table, which we will cover later on.

Once you download the spreadsheet, you can open it to see the available data:

port export 2


The top red square is your transaction history, the bottom red square is your Open Positions. To use this data, you will need to open a new blank spreadsheet and copy these boxes (just like we did above) from one spreadsheet to another.

Start by taking your “Transaction History”, copying the data, and pasting it into a new spreadsheet.

trans history


To start using this data, we will need to look at formatting to make it easier to read.

Formatting Your Data

Now that we have a few saved spreadsheets, we can look at formatting the data to make it easy to read and use later.

Changing Data Order

If we look at the spreadsheets we have saved for our Historical Portfolio Values, it is the exact opposite of what we have for our Historical Prices.

To get them in the same order, we will want to open up our Historical Prices spreadsheet, and order the data from “Oldest” to “Newest”.

We will use the “Sort” function with Excel, or the “Data” function for Google Sheets.

sort excel


sort sheets

We can now choose what we want to sort by, and how to sort it. If you click the drop-down menu under “Sort By”, excel lists all the column headings it detects (select “Date “). Next, under “Order”, we want “Oldest to Newest “:

sort 3

Now your data should be in the same order as your portfolio values from earlier.

Changing Column Width

Next, you’ll notice that some of your data appears just as “########”. This is not because there is an error, the number is just too big to fit in the width of our cell. To fix this, we can increase and decrease the widths of our cells by dragging the boundaries between the rows and columns:

column width

Tip: if you double click these borders, the cell to the left will automatically adjust its width to fit the data in it.

If you want to automatically adjust all your cells at once, at the top menu click “Format”, and “Auto Fit Column Width”:


Once you’ve adjusted your volume column, everything should be visible!

Removing Columns

If we want to use this data for making a graph, we will not need all of the data in the sheet. We really only need the “Date” and “Closing Price”. To keep it easy to read, we will delete some of the extra data.

If you just highlight the data you don’t need and press “Delete”, you will end up with a bunch of blank cells, which is not very useful when trying to read the table:

Instead, click on “B” and drag all the way to “H” to select the full columns:

select columns

Now right-click and click “Delete”, and the entire rows will disappear. Now the Close will be your new column B, with no more empty space. You now have your historical price data, so save this excel file so you can use it later.

Unmerging Cells

Now let’s go back to our Transaction History spreadsheet. With this sheet, we cannot do many of the basic operations because there are some “Merged Cells”. Merged Cells can be used for formatting and presentation, but for now it is just getting in our way.

This is the case with the Ticker, Commission, and Total Amount cells. We need to “unmerge” these cells to make our data usable.

trans history

To do this, select all your data, then on the main menu bar click on “Merge and Center “. Under this, click “Unmerge Cells”. On Google Sheets, this can be done by clicking on the “Format” tab in the navigation bar and then clicking on “Text Wrapping” and then “Clip”.

unmerge cells

Putting It All Together

Now that we have our data all in their own cells, we can start deleting the rows and columns we don’t need. For example, rows 2 and 3 have our beginning cash, which we don’t need in our transaction history. Columns E and H are now blank, so we can get rid of those too. Once you delete the rows and columns you don’t need, you can also autofit the row width to make the “date” visible.

trans formatted

Schedule a call

Get PersonalFinanceLab

This lesson is part of the PersonalFinanceLab curriculum library. Schools with a PersonalFinanceLab.com site license can get this lesson, plus our full library of 300 others, along with our budgeting game, stock game, and automatically-graded assessments for their classroom - complete with LMS integration and rostering support!

Learn More

[qsm quiz=191]

In Economics, “Gross Domestic Product” is the one statistic to rule them all – a measure of the total size of an economy.

Definition

The “Gross Domestic Product” of a country is the total value of all finished goods and services that were produced in a given year. In other words, this is the total economic output. GDP is used to measure the total size of an economy, and therefore how much the economy has grown (or shrunk) in a year.

Calculating GDP

GDP
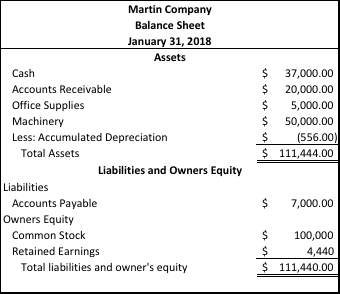
There are a few ways to calculate GDP, but the easiest measurement looks at consumption, investment, government activity, and net exports.

  • Consumption – how many goods and services were purchased by households each year (this doesn’t include business purchases)
  • Investment – how much money was saved, or otherwise invested each year (this does include business investments)
  • Government Activity – how much money the government spent each year
  • Net Exports – How much the country imported vs exported each year

Remember: GDP is supposed to calculate the production in one country each year. If there is household consumption of imported goods, we need to subtract it. If goods are exported and consumed in another country, we need to add it.

Net Exports = Exports – Imports

This means the final calculation for Nominal GDP is:

GDP = Consumption + Investment + Government Spending + Net Exports

Nominal VS Real GDP

Calculating GDP for one year is pretty easy, but GDP numbers are most useful when we compare them from year to year. The only problem is that prices aren’t the same every year – we can’t increase the size of our economy just by doubling all the prices. This means once we calculate the “Nominal” (not adjusted for inflation) GDP above, we need to translate this into a “Real” (adjusted for inflation) GDP to use it for research.

Real GDP = Nominal GDP x (1 – Inflation)

Per Capita GDP

Economists usually want to go one step further – instead of just calculating the size of the economy, we really want to know how much is being produced per worker. This is called “Per Capita” GDP – it lets us see how much more or less each country produces compared to another.

For example, if you look at the GDP of China vs Switzerland, it looks like China is much richer:

Source: World Bank https://data.worldbank.org

However, if we adjust this to look at the output per worker, it shows a much different story:

china switzerland PPP

Government policy is not usually focused on increasing the total GDP, but increasing the Per Capita GDP.

What Causes GDP To Increase?

machinesGDP increases when output increases. When we look at how much a country could potentially produce in a given year, if its resources were all being utilized to the maximum, we would consider:

  • The total population (Quantity of Workers) – how many workers are available?
  • The skill level of the population (Quality of Workers) – how well are the workers trained? Are there a lot of college graduates and skilled tradesmen, or mostly farmers working by hand?
  • Quantity of available capital – how many factories, machines, and tools are available? Having a huge population doesn’t help if they can’t be given the tools to do valuable work!
  • Quality of available capital – how good are the machines and tools available? Are they fairly new and well working, or are they old and out of date?
  • Quantity of natural resources – how big is the country? Is there plenty of farmland and places to mine valuable minerals?
  • Quality of natural resources – how easy is it to get those natural resources? For example, an oil field near a major city in Texas is much easier to drill and exploit than an oil field in the middle of Alaska
  • Level of Technology – how much research and development is going on? How likely is it that even better tools and machines will be produced next year, and how fast can they be produced?
  • Legal and Cultural Institutions – how important is economic growth to the country? Does the government make it possible for new business to start easily, or is there a lot of red tape?

There isn’t much a country can do about their total population or the available natural resources, but governments do focus on improving the rest of these factors to try to improve economic growth.

Leapfrog Effects

Thanks to international trade, GDP tends to grow much faster in countries with lower per-capita GDP. This is because of something called the “Leapfrog Effect”.

Leap FrogThink of it this way: England spent over a hundred years and the equivalent of billions of dollars building railroads all over their country to help speed up trade. Every year, companies would spend millions to make small improvements to the rail engine technology. This slowly improved their technology, quantity, and quality of capital goods.

In contrast, China has been rapidly expanding their rail network starting in the 1950’s.  This means when they first started building their rail networks, they were able to just buy the newest, most up-to-date trains from England, “leap-frogging” a hundred years of research and development to get the same capital goods and level of technology.

This can be risky for the country with the lower per capita GDP. In China’s case, the government mandated that all households needed to make huge cuts to their consumption in order to put all of their existing economic output towards investment to buy the new machines. Since the workers were poor to start with, there were many deaths from starvation. For other countries, they typically take out loans from international banks to pay for the new machines. This is less hard on the workers immediately, but it means they will be saddled with debt until they can earn enough to pay back the loans.

Almost all developing countries accept some of these risks, and use the leapfrog effect to rapidly increase technology, and their GDP with it.

Schedule a call

Get PersonalFinanceLab

This lesson is part of the PersonalFinanceLab curriculum library. Schools with a PersonalFinanceLab.com site license can get this lesson, plus our full library of 300 others, along with our budgeting game, stock game, and automatically-graded assessments for their classroom - complete with LMS integration and rostering support!

Learn More

[qsm quiz=190]

See our introduction webinar to walk through every aspect of creating your class stock, adding assignments, viewing reports, and much more.

Also check our webinar in managing your class Budget Game, including how the game works, class set-up, and teacher reports.

The accounting cycle is a series of steps that businesses take to track transactions and consolidate financial information over a specific accounting period (month, quarter, year). The end result of the accounting cycle is the production of accurate financial statements for that period and preparedness for the next accounting period. We will examine the steps involved in the accounting cycle, which are: (1) identifying transactions, (2) recording transactions, (3) posting journal entries to the general ledger, (4) creating an unadjusted trial balance, (5) preparing adjusting entries, (6) creating an adjusted trial balance, (7) preparing financial statements, (8) preparing closing entries, and (9) preparing the post-closing trial balance.

Identify transactions

Transactions involve buying or selling something and can be defined as ‘the act of conducting business.’ This could involve the exchange or transfer of goods, services, or funds. When a transaction occurs, it is recorded in the company’s accounting system, in the form of a journal entry. However, the transaction must first be identified; for example, if a company purchases machinery, they must add a new asset to the accounting equation.

Identify transactions – example

On January 1, 2018, Martin Company issued 5,000 shares of common stock for cash at $20 per share.  The company also identified the following transactions in January:

Sample transactions

Failing to identify transactions would cause the subsequent steps in the accounting cycle to be inaccurate. Therefore, all transactions must be identified and analyzed or else we will have a flawed financial reporting process.

Effects of Transactions on the Accounting Equation

Each new transaction changes a company’s financial condition and impacts certain asset, liability, and/or equity accounts. The accounting equation is written below:

The accounting equation can be written as:

Assets = Liabilities + Shareholder Equity


The accounting equation will always hold true – if it does not, there is a problem. Properly recorded transactions will keep the accounting equation balanced. This is why it is important to not just identify, but also analyze transactions and record them accurately.

Record transactions

Transactions are first recorded in an accounting system in the form of journal entries. Each transaction must be listed in the appropriate journal and maintained in the order that they occurred. Each journal entry consists of the following information:

  1. The account(s) and amount(s) to be debited
  2. The account(s) and amount(s) to be credited
  3. The date of the transaction
  4. An explanation of the transaction

The following example will demonstrate the recording of the transactions we identified in the first step of the accounting cycle.

Record transactions – example

recording transactions

Each transaction has a debit and a credit entry, is listed in chronological order, and includes a brief description of the transaction itself. Now that each transaction has been properly recorded in the general journal, we are ready to post the journal entries to the general ledger.

Post journal entries to ledger accounts

The general ledger is used to create a company’s financial statements. Once a transaction has been journalized, it is eventually posted (or transferred) to the general ledger. Having a complete listing of transactions in the general ledger will allow us to create the unadjusted trial balance and continue with the steps in the accounting cycle. The following example will demonstrate how we post journal entries from the previous step to the general ledger.

Post journal entries to ledger accounts – example

posting ledger entries

The ending balance in these ledger accounts (in grey) will be used to create the unadjusted trial balance in the next step. Remember: if the trial balance does not balance, something is wrong!

Prepare unadjusted trial balance

At the end of an accounting period, an unadjusted trial balance is created to verify that the total debit entries equal the total credit entries. The unadjusted trial balance is a list of accounts and their balances before any adjusting entries are made to create the financial statements. We will create the unadjusted trial balance by simply entering the ending balances in the ledger accounts from the previous step and adding up the debits and credits to see if they balance.

Prepare unadjusted trial balance – example

unadjusted trial

Looks good! Everything balances and this prepares us to make any necessary adjusting entries to create the adjusted trial balance.

Prepare adjusting entries

Adjusting entries are made at the end of an accounting period (year, quarter, month). These entries alter the final balances of certain ledger accounts to reflect the revenues earned and expenses incurred during an accounting period. This ensures that we comply with the accrual concept of accounting.

Prepare adjusting entries – example

Information for Adjusting Entries:

  • Office supplies with an original cost of $5,000 were unused at the end of the period. Office supplies having an original cost of $17,000 are shown on the unadjusted trial balance.
  • The machinery costing $50,000 has a useful life of 6 years and an estimated salvage value of $10,000. The straight-line depreciation method is used.

adjusting entries

These adjusting entries will be used to adjust the trial balance to reflect changes that need to be made at the end of the accounting period.

Prepare an adjusted trial balance

After adjusting entries have been made, companies prepare an adjusted trial balance. The adjusted trial balance shows the balance of all accounts and includes the adjustments made at the end of the accounting period. In the following example, we will apply the adjusting entries made in the prior step to our unadjusted trial balance.

Prepare an adjusted trial balance – example

Adjusted trial balance

As you can see, ‘Supplies Expense’ increased by $12,000 and ‘Office Supplies’ decreased by $12,000 to reflect an expense we incurred in January, but had not yet recorded. ‘Depreciation Expense’ increased by $556 and ‘Accumulated Depreciation’ increase by $556.

Prepare financial statements

Financial statements can be prepared from the adjusted trial balance. Financial statements provide reporting on a company’s financial results, financial condition, and cash flows.

Prepare financial statements – example

Income Statement

income statemetn

Balance Sheet

balance sheet

Prepare closing entries

In the closing phase of the accounting cycle, the balances of temporary accounts are brought to zero to prepare for the next accounting period. In this step, temporary accounts are essentially ‘emptied out’ into permanent accounts.

Prepare closing entries – example

closing entries

Prepare a post-closing trial balance

The post-closing trial balance eliminates all temporary accounts and leaves only real (or ‘permanent’) accounts. This balances allows us to check our work and determine that we journalized and posted the closing entries properly. The post-closing trial balances can be seen in ‘Step 7’ above as one of the financial statements we created.

Schedule a call

Get PersonalFinanceLab

This lesson is part of the PersonalFinanceLab curriculum library. Schools with a PersonalFinanceLab.com site license can get this lesson, plus our full library of 300 others, along with our budgeting game, stock game, and automatically-graded assessments for their classroom - complete with LMS integration and rostering support!

Learn More

[qsm quiz=189]

There are several popular stock market games available to high school teachers; but only PersonalFinanceLab.com embeds curriculum specifically aligned to the JumpStart Personal Finance Standards. We supply all the material and lesson plans to offer finance in the classroom.

What is PersonalFinanceLab.com?

At the core of PersonalFinanceLab.com is a customizable stock market game for students that allows teachers to create their own custom experiences.  Teachers create their own stock market contest for each class by choosing the trading period dates, the security types they want to allow their students to trade, the diversification rules, and other trading parameters.  The eligible security types include U.S. stocks, bonds, mutual funds, ETFs, options and even cryptocurrencies.  The trading is in real-time, and students’ portfolios and class rankings are updated every minute the markets are open.  The virtual trading technology that powers PersonalFinanceLab.com is from Stock-Trak Inc., the leading provider of educational stock market simulations to the K12 and university markets since 1990.

FINALLY – A Stock Market Game with Built-in Personal Finance Curriculum Aligned To Standards

What makes PersonalFinanceLab.com so unique is that after teachers create their custom stock market contest, they also create their customized assignments by choosing the lessons from the site’s library of over 300 built-in lessons, activities, calculators, etc.   These lessons are embedded into the site so that when students login, they see both their stock portfolio performance and their progress through the assigned lessons.  Finally–Students are forced to work thru curriculum as they research and trade stocks!

Personal Finance Curriculum Overview

Teaching Personal Finance is tough, but we have your back. The Personal Finance curriculum built into PersonalFinanceLab.com is focused on the JumpStart standards. All 300 activities are carefully designed to meet both State and National standards, and can be cherry-picked to meet your specific class’s learning objectives.

Jumpstart financial literacy - finance in the classroom

To jumpstart financial literacy, Click Here for the complete lessons and how they align to these standards.

If you have questions about how PersonalFinanceLab.com can jumpstart financial literacy for high school students, feel free to call 1-800-786-8725 9:30 to 5:00 ET.

To request more information, please complete this form:  https://personalfinancelab.com/get-personal-finance-lab/

Press Release: Quebec, Canada – WEBWIRE – Wednesday, August 8, 2018

Stock-Trak Announces Launch of PersonalFinanceLab.com. This site offers an Online High School Personal Finance Lab. There is a new trend sweeping through magnet schools, CTE programs, and business academies. These schools are converting ordinary classrooms into an exciting and engaging learning environment. They are called a “Personal Finance Lab.”

“High schools have Biology lab. Why don’t they have Personal Finance labs?” is the new rallying cry of Mark Brookshire, Founder, and CEO of Stock-Trak Inc. “Every student will one day have a job, pay taxes, live on a budget, need insurance, use a credit card, and save and invest for retirement. Let’s get students excited to learn about financial literacy. Let’s teach these subjects in an exciting and engaging classroom setting that makes them want to learn.”

Mr. Brookshire has been traveling around the country attending various educational conferences. He promotes his vision for high school Personal Finance Labs. He uses the financial literacy for high school students lesson plans available on PersonalFinanceLab.com to integrate a stock market game with stock market lessons. His idea for these Personal Finance Labs includes scrolling stock tickers, LCD screens, educational wall posters, and a stock market simulation. They include a built-in curriculum from PersonalFinanceLab.com.

stock market simulation for students - stock market simulation - financial literacy lesson plans
“The scrolling stock tickers and the LCD screens that display current stock prices and headline news provide the classroom with that exciting Wall Street feel, and the curriculum and stock simulation of our PersonalFinanceLab.com website provide an engaging learning experience that pulls it all together,” Mr. Brookshire says”

Stock-Trak is the leading provider of educational stock market simulations to the high school and college market. Some universities have built “trading rooms” that use one of Stock-Trak’s virtual trading applications to help teach the Investments and Portfolio Management classes. Unfortunately, very few high schools had moved in that direction. There is a growing emphasis on high school financial literacy classes in many states. Stock-Trak has seen a dramatic increase in high schools using its virtual trading sites (HowTheMarketWorks.com, NationalSMS.com). Classes that typically adopt include Personal Finance, Economics, Business and Social Studies classes.

“More and more teachers have been asking us to integrate Economics, Business, and Personal Finance Curriculum into our virtual trading site. They have also asked how they can get the students more excited about such an important topic” says Mr. Brookshire. “That’s how our Personal Finance Lab concept was conceived. We designed our newest website, PersonalFinanceLab.com, to fill the void and address that need.”

For more information about financial literacy lesson plans using a stock market simulation for students, please visit PersonalFinanceLab.com.

Excellent, authoritative resources for your classroom. Our site allows teachers to use a real-time stock market game to teach personal finance basics. It is only helpful if teachers can find the time to master it as part of their lesson plans.

When we designed Personal Finance Lab, we wanted to make it the easiest-to-use resource to teach personal finance basics. You can get your class up and running in less than 10 minutes. Just three easy steps!

Step 1: Create a Class Contest

The core of Personal Finance Lab is the stock market game for students. When you log in with your teacher account, you’ll be taken straight to the Class Contest Creation page. Here you’ll choose some of the rules for your class portfolios, like:

  • How much cash should my students get?
  • Can they short sell or day trade?
  • Can they borrow money?
  • What types of investments can they make (just stocks, or also things like mutual funds, bonds, options, and cryptocurrencies)?

class creation


Your class is not locked into anyone else – so you pick the rules that work best for your class. This means you select the start dates and end dates that work for you. The more comfortable you get managing your class, the more customization you can do! If it is your first time, we keep it simple. Every rule has a default setting that we find works best with most classes.

If you aren’t sure about anything, we built in both an FAQ explaining each rule, and a live chat with our support team right into the page! The best part is that nothing is set in stone. This is your class with your rules. If you want to change some settings later, you can with just a click of a button!

If you want to see a detailed guide on all the different class rules, click here!

Step 2: Create Your Assignments

Once you set your class rules, jump right in by adding “Assignments.” This is the list of the integrated activities you want your students to complete each week. We make this super simple. Choose what you want your students to do, set a start date and due date, and that’s it!

Assignment Creation


For your first assignment we take out the guesswork. The first ten tasks (the “Investing Fundamentals”) is what your students need to know. This is a simple combination of articles, videos, and infographics explaining the basics of what it means to have a portfolio, and how to make their first trades.

For your next assignments, just scroll down the list and check off the items that you plan on covering in class this week. You can queue up several assignments in advance, or just set them up each week! All of the tasks available align with both State and National standards (and we list which ones), making it super simple to sync up with your class syllabus.

If you want a detailed guide of setting up assignments, click here!

Step 3: Watch Your Students Compete And Learn

Once your class is set up, you’ll get a link you can give your students. They will choose their username and password, and off to the races! As the teacher, you get a birds-eye view of all their activities. You can see every student’s trade, current holdings, progress on their assignments, and even what the most popular trades across your classes are.

personal finance basics - real time stock market game - learn stock market game

You can even export all your class data to spreadsheets for Excel or Google Sheets with just one click, making it super easy to keep tabs on your entire class. Your students can too! All your students can export their trading history, current portfolio, investing dairy, assignment progress, and much more for when they need to make reports and graphs!

If you want to see more about the reporting tools or the real-time stock market game for students, Click Here!

If you can save just $100 per month, you might struggle to decide between putting your money in a savings account, or investing in the stock market.

If you can find a savings account that gives a 3% rate of return, after 10 years you will have saved up $13,980. $12,000 is from cash deposits, and $1,980 from interest.

If you invest in the stock market at the average growth rate of the S&P 500, after 10 years you will have saved up $19,620. $12,000 is from cash deposits, and $7,620 from interest.

Make your money work for you!

The best time to start saving is NOW!

If you can start saving and investing just $110 per month when you turn 18 earning the standard market rate of return, you will have saved up over $1 million by the time you turn 65. This amounts to saving just $62,000 – letting compound interest and the markets do the rest.

If you wait until you are 25 to start saving, you’ll need to increase your monthly savings by $90 per month to reach the same goal – saving up a total of $96,000.

By waiting, you will need to save an extra full year of wages just to reach the same goal! Start saving now, for huge returns in the future!

Saving a million dollars is easier than you think!

If you can invest just $200 per month starting when you turn 18 and earn the average market return, you will have saved up over a million dollars when you turn 58!

It also keeps growing – you will have over $1,800,000 by the time you turn 65 – letting you spend over a hundred thousand dollars per year while your investments continue to grow in retirement!

Bonds are a loan you can make to governments, and they will pay you back regular interest payments. At the end of the bond term, you will also get back the loan amount.

Bonds are very low-risk investments, but also tend to be very low reward (typically not much more inflation). These are a great way to invest if you are unsure about the stock and commodities markets.

Exchange Traded Funds (or ETFs) are investment funds with a lot in common with mutual funds. Instead of being managed by a professional Fund Manager, ETFs are designed to replicate the movement of some other index, such as the S&P 500, or follow the price of oil. These can be used both to diversify a portfolio and to invest in things like commodities, which do not normally trade on the stock exchange.

ETFs are a good way to invest in a broad range of investments all at once, such as broadly investing in Biotech stocks. They can also be used to “Go Short” on a broad index, or even use a Leveraged ETF to double the gains (or losses) of whatever it is tracking!

If you want to diversify but don’t know where to start, the answer might be mutual funds!

Mutual funds are professionally-managed investment funds that you can invest in. Once you invest, a professional Fund Manager will use your money across a wide range of vehicles, which can include stocks, bonds, currencies, commodities, and more. Each mutual fund has its own investment goals and guidelines (and different balances between risk and reward).

The stock market has increased by more than 13 times since 1979, an impressive return! However, stocks are one of the most volatile investments you can make – and choosing individual stocks can be risky.

If you want to chase impressive returns from individual companies, stocks are the way to go. If you want a more hands-off investment with fewer ups and downs, you might want gold, mutual funds, or ETFs.

Keep in mind that smart investors keep a healthy mix of different investment types as part of their diversification strategy!

The price of Gold generally goes up when the markets go down, as investors think it will hold its value if stocks start to fall.

Since 1979, the S&P 500 grew 13 times faster than the price of Gold. However, during the last market crash, Gold almost doubled its price (from its lowest to highest points), while the S&P 500 lost half of its value (from the highest to its lowest point).

If you are worried about a stock crash, gold might be a good place to invest. If you think the stock market is strong, stick to stocks, mutual funds, and ETFs!

The first step to starting a budget is to understand how you spend your money NOW.

For the next month, write down absolutely everything you spend your money on – from school lunches to cups of coffee to clothes, and everything in between!

At the end of the month, take a look at all your spending, and try to categorize it (Food, Clothing, Transportation, ect). This will let you see what you are spending now. Now you can decide if you are happy with your current spending, or if you want to set different goals for next month!

A “Spending Plan” is similar to a budget, but a bit easier to manage and follow. With a spending plan, you will not try to allocate every dollar of your income to either saving or spending, but set a general guide on how much you usually spend for different things.

By setting aside your savings before even looking at your other expenses, most people find it much simpler to stay under budget!

If you have income and expenses, you need a budget! Budgets are living tools that you can use to visualize how much you spend every month, and are essential to setting and meeting your savings goals.

Long Stock

What is a long stock?

A long stock is an expression used when you own shares of a company. It represents a claim on the company’s assets and earnings. As you increase your holdings of a stock, your ownership stake in the company increases. Words such as “shares”, “equity” and “stock” all mean the same thing. In the world of trading, being long on a stock means that you currently purchased shares of a company and have it part of your open positions.

What are its components? Can you show me how to long a stock on a trading platform?

The components of a long stock are quite simple. You simply need to perform a buy order to open a long position on a stock:

When and why should I have a long stock?

            You should have a long stock when you expect the stock price to go up. In other words, you have a bullish position on the security.

What does it look like graphically? What is the payoff and profit graph?


Short Stock

What is a short stock?

A short stock is an expression used when you sold shares of a company that you did not own beforehand. Let’s say you expect a stock’s price to drop. Shorting a stock would involve a strategy where you borrow shares from another party (usually a broker) and sell it on the market. Borrowing from a third party implies that you will have margin requirements, which is cash set aside for the borrower’s protection on the asset. You would close this position by buying back the quantity of shares at a lower price, return the shares to the broker and pocket the difference as a gain (or a loss, if you purchased the stock at a higher price). Words such as “shares”, “equity” and “stock” all mean the same thing.

In the world of trading, being short on a stock means that you currently sold shares of a company and have a negative number of shares in your open positions. You would eventually bring back this number to zero by covering (buying back) these shares in the future.

What are its components? Can you show me how to short a stock?

The components of a short stock are quite simple. You simply need to perform a short sell order to open a short position on a stock:

When and why should I have a short stock?

            You should short sell a stock when you expect the stock price to go down. In other words, you have a bearish position on the security.

What does it look like graphically? What is the payoff and profit graph?


Schedule a call

Get PersonalFinanceLab

This lesson is part of the PersonalFinanceLab curriculum library. Schools with a PersonalFinanceLab.com site license can get this lesson, plus our full library of 300 others, along with our budgeting game, stock game, and automatically-graded assessments for their classroom - complete with LMS integration and rostering support!

Learn More

[qsm quiz=188]


Schedule a call

Get PersonalFinanceLab

This lesson is part of the PersonalFinanceLab curriculum library. Schools with a PersonalFinanceLab.com site license can get this lesson, plus our full library of 300 others, along with our budgeting game, stock game, and automatically-graded assessments for their classroom - complete with LMS integration and rostering support!

Learn More

[qsm quiz=187]


Schedule a call

Get PersonalFinanceLab

This lesson is part of the PersonalFinanceLab curriculum library. Schools with a PersonalFinanceLab.com site license can get this lesson, plus our full library of 300 others, along with our budgeting game, stock game, and automatically-graded assessments for their classroom - complete with LMS integration and rostering support!

Learn More

[qsm quiz=186]


Schedule a call

Get PersonalFinanceLab

This lesson is part of the PersonalFinanceLab curriculum library. Schools with a PersonalFinanceLab.com site license can get this lesson, plus our full library of 300 others, along with our budgeting game, stock game, and automatically-graded assessments for their classroom - complete with LMS integration and rostering support!

Learn More

[qsm quiz=185]


Schedule a call

Get PersonalFinanceLab

This lesson is part of the PersonalFinanceLab curriculum library. Schools with a PersonalFinanceLab.com site license can get this lesson, plus our full library of 300 others, along with our budgeting game, stock game, and automatically-graded assessments for their classroom - complete with LMS integration and rostering support!

Learn More

[qsm quiz=184]


Schedule a call

Get PersonalFinanceLab

This lesson is part of the PersonalFinanceLab curriculum library. Schools with a PersonalFinanceLab.com site license can get this lesson, plus our full library of 300 others, along with our budgeting game, stock game, and automatically-graded assessments for their classroom - complete with LMS integration and rostering support!

Learn More

[qsm quiz=183]

A butterfly is a volatility bet that the trader can implement to protect against large fluctuations, or to gain on volatility. You will notice that a butterfly is almost like a straddle, with a difference in the edges. The traders can add additional contracts to his/her strategy to reduce the risk of large losses or gains for more protection.  A butterfly can be executed in different ways: with puts only, calls only, or a mix of both.

What are its components?

A long butterfly can be created in three ways:

  • Butterfly with puts only
    • Buy Put at strike price 1
    • 2 x Sell Put at strike price 2
    • Buy Put at strike price 3
  • Butterfly with calls only
    • Buy Call at strike price 1
    • 2 x Sell Call at the strike price 2
    • Buy Call at strike price 3
  • Butterfly with puts and calls
    • Buy Put at strike price 1
    • Sell Put at strike price 2
    • Sell Call at strike price 2
    • Buy Call at strike price 3
  • (*A short butterfly can be created by implementing the reverse strategies above)

When and why should I have a butterfly?

You should have a butterfly if you expect to see a lot of fluctuation in the underlying asset’s price. Creating a butterfly does not infer that you have a specific view on the stock. It simply implies that the trader expects a lot of volatility and executed a strategy to gain something from it. You can create a short butterfly if you do not expect any fluctuations.

What does it look like graphically? What is the payoff and profit graph?

What is the break-even point?

The break-even point of a butterfly can be defined by finding the stock price where the butterfly generates a zero-dollar profit. By adding all contracts and equating it to zero, you should solve for ST. However, there is a possibility where a region of stock prices can break-even. To find this region, you should create scenarios to define the payoffs. For example, the payoff when ST<30, 30<ST<40, 40<ST<50 and 50<ST.

A strangle is a volatility bet where you simultaneously long a call at Strike Price 2 and long a put at Strike Price 1. You will notice that the difference with a straddle is the difference strike price for the long call. By buying a call with a higher strike price, you are buying a cheaper call, thus reducing the transaction costs.

A strangle has payoff/profit that is somewhat similar to a straddle. The difference resides that there is a region between strike price 1 and strike price 2 where the payoff/profit is stable. Traders can also bet again volatility by shorting a call at Strike Price 2 and selling a put at Strike Price 1.

What are its components?

A long straddle has two components:

  • Long put at strike price 1
  • Long call at strike price 2

*(A short straddle can be created by shorting a call at strike price 2 and shorting a put at strike price 1)

When and why should I have a strangle?

You should have a strangle if you expect to see a lot of fluctuation in the underlying asset’s price. Creating a strangle does not infer that you have a specific view on the stock. It simply implies that the trader expects a lot of volatility and executed a strategy to gain something from it.

What is the payoff and profit graph?

What is the break-even point?

The break-even point of a strangle can be defined by finding the stock price where the strangle generates a zero-dollar profit. By adding all contracts and equating it to zero, you should solve for ST. However, there is a possibility where a region of stock prices can break-even. To find those two points, you should create scenarios to define the payoffs. For example, the payoff when ST<40, 40<ST<50 and 50<ST.

A straddle is a volatility bet where you simultaneously long a call at Strike Price 1 and long a put at Strike Price 1. This creates a triangular shaped payoff and profit graph where the reward is based on the volatility of the stock. Traders can also bet against volatility by shorting a call at Strike Price 1 and selling a put at Strike Price 1.

What are its components?

A long straddle has two components:

  • Long put at strike price 1
  • Long call at strike price 1

*(A short straddle can be created by short both the call and put at strike price 1)

When and why should I have a straddle?

You should have a straddle if you expect to see a lot of fluctuation in the underlying asset’s price. Creating a straddle does not infer that you have a specific view on the stock. It simply implies that the trader expects a lot of volatility and executed a strategy to gain something from it.

What is the payoff and profit graph?

What is the break-even point?

The break-even point of a straddle can be defined by finding the stock price where the straddle generates a zero-dollar profit. By adding all contracts and equating it to zero, you should solve for ST. However, there is a possibility where there are two stock prices that can break-even. To find those two points, you should create scenarios to define the payoffs. For example, the payoff when ST<40 and 40<ST.

A bullish collar is a protection strategy where you simultaneously buy a call at strike price 1 and sell a put at strike price 2. This strategy is for investors who has a bullish perception on the underlying asset. We can also create a “bearish” collar by simultaneously buying a put at strike price 1 and selling a call at strike price 2.

What are its components?

A “bearish collar” has two components:

  • Buy put at strike price 1
  • Short call at strike price 2

A “bullish collar” has two components:

  • Buy call at strike price 1
  • Short put at strike price 2

When and why should I have a collar?

You should have a collar if you strongly believe that the stock price will either be bullish or bearish. Graphically, a collar looks like a stock’s graphs, but with a width where the payoff is stable. By shorting the second option contract, you are covering your options costs for the first option contract. However, should the price go in the opposite direction, you will have a large loss.

What is the payoff and profit graph?


What is the break-even point?

The break-even point of a collar spread can be defined by finding the stock price where the spread generates a zero-dollar profit. By adding all contracts and equating it to zero, you should solve for ST. However, there is a possibility where there is a range of stock prices that can break-even. To find that range, you should create scenarios to define the payoffs. For example, the payoff when ST<30, 30<ST<40, 40<ST.

A ratio is an option strategy that is created by having X amount of call options at Strike Price 1 and shorting Y amount of call options at Strike Price 2. By creating a ratio, you are creating an option strategy where you can reduce your total option costs by shorting more call options are a higher strike price.

What are its components?

A ratio strategy has four components:

  • X amount of long call options
  • Y amount of short call options

When and why should I have a ratio strategy?

You should have a ratio strategy if you have a bullish view on the performance of the underlying asset. By shorting Y amount of call options, you are consistently reducing your option costs and eventually creating a zero-cost strategy. The ratio can be adjusted based on the investor’s perception of asset. The same concept can be applied with puts.

What is the payoff and profit graph?

What is the break-even point?

The break-even point of a ratio strategy can be defined by finding the stock price where the bear spread generates a zero-dollar profit. By adding all contracts and equating it to zero, you should solve for ST. There is a possibility where two stock prices can break-even. To find both points, you should create scenarios to define the payoffs. For example, the payoff when ST<30, 30<ST<40, 40<ST.

A box spread is an option strategy that is created by combining the components of the bull spread and the bear spread. By creating a box spread, you are creating a neutral riskless position that generates a return like a bond. A box spread can be used to borrow or lend funds.

What are its components?

A box spread has four components:

  • Long call at strike price 1
  • Short call at strike price 2
  • Short put at strike price 1
  • Long put at strike price 2

When and why should I have a bear spread?

You should have a box spread if you have a neutral view on the stock’s performance. The box spread will give the trader the ability to lend or borrow cash using a box spread.

What is the payoff and profit graph?

What is the break-even point?

Since the box spread has a payoff and profit structure like a bond, it does not have a break-even point.

A bear spread is a strategy where you simultaneously sell a put at Strike Price 1, and buy a put at Strike Price 2. Recall that users will pocket the premium should the option not be exercised. By selling a put with a lower strike price, users can reduce their total transaction costs and create a strategy that can generate a fixed income like in a bull spread.

What are its components?

A bear spread has two components:

  • Short a put at strike price 1
  • Buy a put at strike price 2
  • (*A bear spread can also be created with puts)

When and why should I have a bear spread?

You should have a bear spread if you are moderately bearish on a stock and wish to enter a bearish position with protection. By having a long put, you will have a bearish position on a stock and a protection should the stock increase. This position entails that you will pay a premium, where the short option comes in play and reduces your costs. By doing this additional transaction, you are willing to reduce your gains for a lower transaction costs and a steady income stream once the stock performs at a price below strike price 1.

What is the payoff and profit graph?

What is the break-even point?

The break-even point of a bear spread can be defined by finding the stock price where the bear spread generates a zero-dollar profit. By adding both puts together and equating it to zero, you should solve for ST.

A bull spread is a strategy where you simultaneously buy a long call at Strike Price 1, and sell a call for Strike Price 2. Recall that users will pocket the premium should the option not be exercised. By selling a call with a higher strike price, users can reduce their total transaction costs and create a strategy that can generate a fixed income like in a bull spread.

What are its components?

A bull spread has two components:

  • Long call at strike price 1
  • Short call at strike price 2
  • (*A bull spread can also be created with puts)

When and why should I have a bull spread?

You should have a bull spread if you are moderately bullish on a stock and wish to enter a bullish position with protection. By having a long call, you will have a bullish position on a stock and have a protection should the stock decrease. This position entails that you will pay a premium, where the short option comes in play and reduces your costs. By doing this additional transaction, you are willing to reduce your gains for a lower transaction costs and a steady income stream once the stock performs at a price above strike price 2.

What is the payoff and profit graph?

What is the break-even point?

The break-even point of a bull spread can be defined by finding the stock price where the bull spread generates a zero-dollar profit. By adding both calls together and equating it to zero, you should solve for ST.

A cap is an options protection strategy where you simultaneously have a short position on a stock and a long call for the same underlying asset. Adding a long call to your open position means that you are obligated to buy your stock at the strike price. However, you already have a short position on the asset, which means this call option will help you close your position on the stock by buying back the shares at a fixed price. You will gain the difference from the short stock and the long call. The combination of those two products creates a payoff that is like a long put. However, the profit is not the same since you spent more on a cap versus a put option.

What are its components?

A cap has two components:

  • Short Stock
  • Long Call

When and why should I have a cap?

You should have a cap if you are bearish on a stock and wish to have an extra protection in case the price of the stock goes up. By adding a long call to your long position, you are willing to reduce your profit should the stock price decrease to create a ‘cap’, which is the lowest profit you can attain if the price is higher than the strike price.

What is the payoff and profit graph?

What is the break-even point?

The break-even point of a cap can be defined by finding the stock price where the cap generates a zero-dollar profit. By adding the short stock and long call together and equating it to zero, you should solve for ST.

A floor is an options insurance strategy where you simultaneously have a long open position on a stock and a long put for the same underlying asset. Adding a long put to your open position means that you are obligated to sell your stock at the strike price. The long put ensure that you can sell your stocks at a defined price. Since you already have the stock in your open position, you will gain the difference from the long stock and long put. The combination of those two products creates a payoff that is like a long call. However, the profit is not the same since you spent more on a floor versus a call option.

What are its components?

A floor has two components:

  • Long Stock
  • Long Put

When and why should I have a floor?

You should have a floor if you are bullish on a stock and wish to have an extra protection in case the price of the stock goes down. By adding a long put to your long position, you are willing to reduce your profit should the stock price increase to create a ‘floor’, which is the lowest profit you can attain if the price is lower than the strike price. Creating a floor guarantees a minimum stock price for which you can close your current position.

What is the payoff and profit graph?

What is the break-even point?

The break-even point of a floor can be defined by finding the stock price where the floor generates a zero-dollar profit. By adding the long stock and long put together and equating it to zero, you should solve for ST.

A covered put is an options insurance strategy where you simultaneously have a short open position on a stock and sell a put option for the same underlying option. Adding a short put in your open positions means that you are obligated to buy your stocks at the strike price, contingent on the option buyer’s actions. However, you already have the short stock in your open position, which means you will gain the difference from the short stock and the short put. The combination of those two products creates a payoff that is like a short call. However, the profit is not the same since you spent more on a covered put versus a short call.

What are its components?

The covered put has two components:

  • Short Stock
  • Short Put

When and why should I have a covered put?

You should have a covered put if you are moderately bearish on a security and wish to have an extra protection in case the price of the stock goes up. By adding a short put to your short position, you are willing to forego the additional profit should the stock drop for protection if the stock increase in price. The effect of adding a short put to your short position can be seen in the profit tables below.

What is the payoff and profit graph?

What is the break-even point?

The break-even point of a covered put can be defined by finding the stock price where the covered put generates a zero-dollar profit. By adding the short stock and the short put together and equating it to zero, you should solve for ST.

A covered call is an options insurance strategy where you simultaneously have an open position on a stock and sell a call option for the same symbol. Adding a short call in your open positions means that you are obligated to sell your stocks at the strike price contingent on the option buyer. However, you already have the stock in your open position, which means you will gain the difference from the long stock and the short call. The combination of those two products creates a payoff that is like a short put. However, the profit is not the same since you spent more on a coverall call versus a short put.

What are its components?

The covered call has two components:

  • Long Stock
  • Short Call

When and why should I have a covered call?

You should have a covered call if you are moderately bullish on a security and wish to have an extra protection in case the price of the stock goes down. By adding a short call to your stock, you are willing to forego the additional profit should the stock surge for protection if the stock drops in price. This can be seen in the individual profits of these two components, versus the covered call’s profit.

What is the payoff and profit graph?

What is the break-even point?

The break-even point of a covered call can be defined by finding the stock price where the covered call generates a zero-dollar profit. By adding the long stock and the short call together and equating it to zero, you should solve for ST.

A long call is a term used when you own a call option for an underlying asset. A call option is a contract where the buyer has the right (not the obligation) to exercise a buy transaction at a specific strike price at or before an expiration date.

In the world of trading, owing a long call means that you have a contract that gives you the right to buy the underlying asset at a specific price, before a maturity date. Once the contract is exercised, the contract disappears and the underlying asset will be part of your open positions at the specified strike price. If you had a short position on the asset beforehand, exercising this contract will be expressed as if you have covered your short position. The alternative of exercising would be to sell your option contract to another trader on the market.

What are its components? Can you show me how to have a long call in my open positions?

The components of a long call are quite simple. You simply need to perform an order to buy to open an option contract based on your desired specifications:

When and why should I have a long call?

            You should have a long call option if you expect the stock price to go up, but would like to have a cushion of protection. As an example, if you own solely the underlying asset and the price goes down, the lost will have a stronger impact on the underlying asset than on the option contract.

What does it look like graphically? What is the payoff and profit graph?

What is the Break Even Point?


Recall that a call option is a contract where the buyer has the right (not the obligation) to exercise a buy transaction at a specific strike price at expiration date. A short call is a term used when you sell a call option for an underlying asset.

A trader that has a short call option is also referred as a trader that wrote a call option. This means that the trader wrote this option contract with a belief that the buyer of the contract will not exercise it. If this happens, the writer will pocket the premium from selling the contract. If the buyer of the call option does exercise his right, the writer will have to sell him the shares, with respect to the specifications of the contract. In other words, a call option writer has an obligation to sell shares of the underlying asset, contingent on the buyer’s decision to exercise his rights.

In the world of trading, a short position on a call option (“sell to open”) means that you sold a contract that gives the buyer of that contract the right to buy the underlying asset at a specific price at a maturity date. If the buyer decides to exercise his right, you are obligated to provide him the shares with respect to the requirements that you have both agreed upon. It is important to note that the seller of a call option has no exercising rights. Thus, the only way to close this option contract would be to “buy to close” or cover the contract in question.

What are its components? Can you show me how to short sell a call option?

The components of a short call are quite simple. You simply need to perform an order to sell to open an option contract based on your desired specifications:

When and why should I have a short call?

You should short a call option if you expect the stock price to remain below the strike price. In a situation where the stock’s price is below the strike price, you will be able to gain the premium, since the buyer did not exercise his right. Evidently, writing a naked call (without being the owner of the underlying asset) can be very risky should the price surges beyond the strike price. Traders write options to implement it to certain strategies that will be discussed later.

What does it look like graphically? What is the payoff and profit graph?

What is the break-even point?

A long put is a term used when you own a put option for an underlying asset. A put option is a contract where the buyer of the put has the right (not the obligation) to exercise a sell transaction at a specific strike price before an expiration date.

In the world of trading, owning a long put means that you have a contract that gives you the right to sell the underlying asset at a specific price, before a maturity date. Once the contract is exercised, the contract disappears and the underlying asset will be sold at the specified strike price. If you already have the asset in your open positions, it will be sold at the specified price. If you do not own the asset, the sell action will be expressed as if you have shorted the stock. The alternative of exercising would be to sell your contract to another trader on the market.

What are its components? Can you show me how to long a put option?

The components of a long put are quite simple. You simply need to perform an order to buy to open an option contract based on your desired specifications:

When and why should I have a long put?

            You should have a long put option if you expect the stock price to go below a specific price, but would also like to have a cushion of protection. As an example, if you short sell the underlying asset and the price goes up, the loss will have a stronger impact on the underlying asset than on the contract.

What does it look like graphically? What is the payoff and profit graph?

What is the break-even point?

Short Put

Recall that a put option is a contract where the buyer has the right (not the obligation) to exercise a sell transaction at a specific strike price before an expiration date. A short put is a term used when you sell a put option for an underlying asset.

A trader that has a short put option is also referred as a trader that wrote a put option. This means that the trader wrote this option contract with a belief that the buyer of the contract will not exercise it. If this happens, the writer will pocket the profits from selling the contract. If the buyer of the put option does exercise his rights, the writer must buy from him/her the shares, with respect to the specifications of the contract. In other words, an put option writer has an obligation to buy shares of the underlying contingent on the option buyer’s actions.

In the world of trading, a short position on a put option (“sell to open”) means that you sold a contract that gives the buyer of that contract the right to sell the underlying asset at a specific price, before a maturity date. If the buyer decides to exercise his right, you are obligated to purchase from him the shares with respect to the requirements that you have both agreed upon. It is important to note that the seller of a put option has no exercising rights. Thus, the only way to close this option contract would be to “buy to close” or cover the contract in question.

What are its components? Can you show me how to short sell a put option?

The components of a short put are quite simple. You simply need to perform an order to sell to open an option contract based on your desired specifications:

When and why should I have a short put?

You should short a put option if you expect the stock price to remain above the strike price. In a situation where the stock’s price is above the strike price, you will be able to pocket the premium, since the buyer did not exercise his right. Evidently, writing a naked put can be very risky should the price drop below the strike price. Traders write options to implement it to certain strategies that will be discussed later.

What does it look like graphically? What is the payoff and profit graph?

What is the break-even point?