The primary goal of the project is to gain an understanding of the investment process by becoming an interested participant. Students will participate in a portfolio simulation exercise by trading an initial wealth of $500,000.

Can we play the game in a group?

You can form groups of two, or play the game on your own, as you prefer. Each group of two needs only one Stock-Trak account.

What is the goal of the investment simulation?

Your goal is to maximize your risk-adjusted return, defined as the Sharpe ratio of your portfolio. Requirements for each student include: (1) tracking the performance of their portfolio each week through the semester; (2) being prepared for classroom discussion of macroeconomic, financial market, or other news events that might affect the risk and return of their portfolios; and (3) producing a report analyzing the performance of their portfolio over the semester. More details about the report are on the next page.

If it’s a game, who wins?

I’d like to think we’re all winners, but the investors who achieve the highest risk-adjusted return (as measured by the Sharpe ratio of their portfolio) will get an extra 5 points on their (50 point) Stock-Trak Report #3.

What assets can we trade?

Only common stocks, mutual funds and ETFs can be traded in the game (no bonds, no derivatives, no exceptions).

How do we trade?

Stock-Trak offers Web trading; details are in the registration materials or on the Web. Your account is limited to 200 trades for the semester; market orders and limit orders are allowed.

Do we ha-a-a-ve to trade? (often asked in a whiny voice)

Yes. Each investor group must execute at least 20 trades (defined as a purchase or short sale of a stock, mutual fund, or ETF) over the course of the game. For each trade short of this goal you will lose 2 points on your (50 point) Stock-Trak Report #3. See the Stocktrak Strategies handout for some ideas on how to get started. Note: a purchase and subsequent sale of a stock counts as one trade.

How do we track our performance?

Tracking your weekly performance using Stock-Trak’s web site is the best way to go. Registering and setting up a portfolio list in Yahoo! Finance (or any other financial web site that you are familiar with) seems like the easiest way to keep track of real-time news about any stocks that you have traded.

What should we do right away?

  1. Download and read the Stock-Trak rules (link is on class page).
  2. Register with Stock-Trak (on their Web site) as soon as possible to get ready to trade.
  3. Begin tracking the week-to-week performance of both your portfolio and your benchmark, including saving any news items you find regarding your stocks. Friday closing values will be needed to write your reports.
  4. Collect print or Internet articles that discuss your stocks and/or investment strategies. These will come in handy, for reference purposes, in writing your reports.
  5. Do not hesitate to talk to me about any issues or questions I have omitted.


A Brief yet Helpful Guide to the TPS[1] reports

For all reports, graphs, tables and charts that support statements made in your report should be placed in an appendix and should not be included in the page count for the report.

Report 1 (due 10/7; 2 pages max) 6% of final grade

  • Discuss your beginning portfolio strategy and security selection process. What index are you going to try to beat with your stock picks? Why did you pick that index?
  • In an appendix, present a “timeline” or chronicle of each of your trading decisions, and the thought process behind each trade. If you used a stock screener to pick stocks, be specific about the screens you used.

Report 2 (due 11/4; 2 pages max) 6% of final grade each

  • How did your portfolio/stock picking strategy change during this session, either in response to concepts discussed in class, or in response to economic (market, industry, or company-specific) events during the semester?
  • In an appendix, present a “timeline” or chronicle of each of your trading decisions, and the thought process behind each trade. If you used a stock screener to pick stocks, be specific about the screens you used.

Report 3 (due 12/2; 5 pages max) 13% of final grade

Your final report should contain three main sections:

  1. Returns analysis
  • Compute the average weekly return on your portfolio and your benchmark.
  • Did you beat the benchmark you selected at the beginning of the quarter?
  • Which three securities were your biggest winners? Which three were your biggest losers? Measure winners and losers in percent, not dollars. What were the firm-, industry- or market-related events that led to the extreme performance of these six stocks? Be specific. You may include print or Internet articles that support your analysis in your appendix.
  1. Risk analysis
  • Compute the s of your portfolio’s and your benchmark’s weekly returns, as well as your portfolio’s b (using your benchmark index as “the market”).
  • On a risk-adjusted basis, did you beat your benchmark? Compute both the Sharpe ratio and Treynor measure. Which of these measures is most appropriate for evaluating your performance? (Think about what the R2 of your portfolio beta regression tells you about this last question.)
  • Compute your up-market and down-market betas. Were you good market timers or bad market timers?
  1. Conclusions
  • Conclude with a critique of your portfolio – what would you have done differently knowing what you know now? This does not mean using perfect hindsight to decide what stocks you should have purchased! Rather, suppose you were starting Stock-Trak today. Given your current knowledge of the stock market compared to earlier in the semester, what would you have do differently in terms of your portfolio strategy and your security selection process? What lessons from the game will be useful as you save for retirement?

Remember that NONE of the project grade is related to how much money you made or lost! Your grade will be based on a clear and concise discussion of what happened during the semester. Good reports will also successfully incorporate concepts highlighted in the course.


[1]TPS = Tracking the Performance of Stocks. Be sure that your reports have the right cover page.

Fractions

What is a fraction?

A “Fraction” means one piece of a whole. You can use fractions in any case where it might be useful to look at something in parts, rather than the whole thing at once.

The most delicious fractions are slices of pizza. If the pizza is in 8 slices, we know that there are 8 parts. This means any time we’re talking about its parts, we know it is “__ out of 8”, or “__ / 8”. For the whole pizza, we have all 8 slices.

Now let’s eat a slice! That will remove 1 of our slices and leave us with 7 and we had 8 slices originally. Or as a fraction:

The bottom number in the fraction is the whole and the top number in the fraction is how much we have currently (in this case, seven slices of pizza).

Example Using Your Portfolio

If you look at your pie chart, you can also see examples of fractions with your pie chart:

In this case we can’t divide the pie into equal pieces like we did with the pizza, since some stocks have a lot more than others. However, we can still show what “Fraction” of our portfolio is taken up by each stock.

In this example, lets say our portfolio has NKE(Nike), MCD (Mcdonald’s), NFLX (Netflix), AAPL (Apple).

Even though each stock is taking up different amounts of the whole, if we divide our portfolio in to equal parts, we can still get the fraction taken up by each stock.

Now if you want to know how much of each stock we have as a fraction. We count how many wedges (or slices) we have total: 10

Then we count how many of each stock we have (count the same colors)

Just like before, the bottom number in the fraction is called the “Denominator” and is how many parts are in the whole.

The top number in the fraction is called the “Numerator” is how many parts we have:

If we added all of of these fractions together we would get 10 / 10 which is equal to 1 (meaning the whole).

Comparing Fractions

You can only compare two fractions that have the same “Denominator“. For example, we know that 3/10 is bigger than 2/10, but you cannot directly compare it to 2/3. When you see the “/” sign, or whatever separates the numerator and the denominator, it means “Out Of” (so “1/10” means “1 out of 10”)

If you do want to compare two fractions, one way is to multiply them so their denominators are the same. In this example, we can convert our fractions to both be showing their value out of 30 parts instead of 10 or 3.

To do this, multiply both the numerator and denominator of each fraction until the denominator is the “Common” number.

As long as you multiply the numerator and denominator by the same number, the fraction’s value will stay the same (“2 out of 3” is the same as “20 out of 30”). Now both of our denominators are 30, so we can compare them directly!

When You Cannot Use Fractions

Fractions are only used to look at parts of one thing, they are not used to compare different things. For example, we can use a fraction to show how much of our portfolio is made up of one stock, but we cannot use a portfolio to compare a company’s stock price to how much money it makes.

Percentages

Fractions work well when what we are looking at is always different parts of the same whole, but when we want to compare parts of different things, we need to use percentages. A percentage is a calculation that will tell you how big one thing is in relation to another thing. For example, you can use a percentage to tell how big your current portfolio value is compared to how much you started with.

Percentages work like fractions, but the denominator is always 100, so you can always know which percentage is bigger or smaller. You can convert any fraction in to a percentage to compare them. This means when you see a percentage, the “%” sign means “Out of 100“.

Calculating Your Portfolio Return

In the rankings page you will be able to see Gain / Loss (%). We call this your Portfolio Return.

This is calculated by looking at the current value of your portfolio and compare it to your starting value and multiplying by 100.

Or ((Current Value / Starting Value) – 1) * 100 . You have to do it in this order: (Current Value / Starting Value) then subtract 1 and then multiply by 100.

  1. Divide Current Value / Starting Value. This scales down both numbers so that “Starting Value” = 1. If your Current Value > Starting Value, the number you’ll get will be bigger than 1. If your Current Value < Starting Value, this number will be less than 1.
  2. Subtract 1 from the result. This means makes the “comparison number” 0 instead of 1.
  3. Multiply the result by 100. This makes your comparison 100 instead of 0.

For education1 on the rankings page above, you can calculate the Portfolio Return with the same steps:

  1. 103,985.43 / 100,000 = 1.0398543
  2. 1.0398543 – 1 = 0.0398543
  3. 0.0398543 X 100 = 3.98543% (we around the percentage to 2 decimal places, so it appears as 3.99%).

Calculating Stock Return

Percent Return is very useful for comparing different stocks too.

The NFLX stock (1.54%) has a higher percentage return than the AAPL stock (1.24%) even though the number of AAPL (11.85) is higher than (8.05).

$11.85 is the amount of dollars you gained. The 1.24% is how much the stock price went up by. The percentage (bottom number) is much more important than the amount of dollars (top number), because it tells you how much the value changed compared to the price you bought it at.

This is because of the number of shares and the price. To calculate the percentage, compare the last price and divide it by the price paid or

((Last Price / Price Paid) – 1) * 100 :

AAPL :  ((96.70 / 95.52) -1) *100 = 1.24%

NFLX: ((106.06.70 / 104.45) -1) *100 = 1.54%

Relationship Between Percentages And Fractions

Lets go back to the pie charts we were using for fractions. Every fraction can be written as a percentage, with the “Whole” equalling 1

We bought 10 shares of AAPL (Apple), 5 shares of NKE (Nike) and 5 shares of NFLX (Netflix).

The numbers show the percentage of each stock’s value over your total value of your portfolio. Written as a fraction, it would be

Value of this stock in your portfolio / Total Value Of All Your Stocks

Going back to the portfolio example, we can calculate the percentage of each stock by comparing their Market Value with the total value of all of our stocks

To get these numbers we first grab the market value for each stock and add them together, so in our example:

292.75 (NKE) + 958.20 (AAPL) + 532.00 (NFLX) = 1782.95 = Total Value

Then if we want the percentage like in the pie chart for NKE, we compare the value of NKE to the Total Value:

NKE: ((292.75 / 1782.95) – 1 * 100 = 16.4 %

AAPL: ((958.20 / 1782.95) – 1 * 100 = 53.7 %

NFLX: ((532 / 1782.95) – 1 * 100 = 29.8 %

Both the fractions and the percentages will always equal 100 / 100 or 100% because our pie is whole.

By summing up 16.4 % + 53 .7 % + 29.8 % = 100 %

When To Use Percentages

Percentages are used normally to calculate the growth in something over time (like your portfolio return), or to compare parts of a whole when the denominators would be bigger than 10 (in our fraction conversion example, we can also say 2/3 = 66.6% and 2/10 = 20%).

Ratios

Ratios are a lot like fractions, but the biggest difference is that we only use ratios to compare different things. For example, if we want to compare the price of a company’s stock with how much money that company makes per share, we would use what is called the “Price – Earnings Ratio”. Since the “price of a stock” is not a part of “how much the company makes per share”, we would not be able to use a fraction. We would want to know the P/E ratio because that tells us how much the company is actually making compared to how much we’re paying for a share of it.

We can actually get all of this information on the Quotes page and find the P/E Ratio ourselves. EPS is the “Earnings per Share”. With Apple (AAPL) as the example:

The stock price is $100.15, while the Earnings-per-Share (EPS) for the last 12 months is $9.21. We can wright the ratio as

$100.15 : $9.21

When we read ratios, the “:” symbol means “to”, so we would say “100.15 to 9.21”.

Calculating this value is also easier than calculating a percentage. Simply divide the number on the left by the number on the right:

100.15 / 9.21 = 10.5 = PE Ratio

The P/E ratio gives an idea of how much investors are valuing the company’s current income – high P/E ratios mean investors expect the revenue to grow a lot in the future, low P/E ratios mean investors think the company will grow more slowly. By calculating the P/E ratio for different companies, you can compare the investor attitudes easily.

Pop Quiz

[qsm quiz=53]

In this article we will be looking at how you can use Excel to keep track of your account’s performance. This is meant as a basic guide for people who have little or no experience with Excel.

Using Excel To Track Your Stock Portfolio – Getting Some Data

Before we can do anything with Excel, we need to get some numbers! The information you use in excel is called “Data”. Some of it we will need to write down, some can be copied and pasted, and some we can download directly as an excel file.

Getting Your Historical Portfolio Values (Typing Numbers In The Spreadsheet)


You can find your Historical Portfolio Values on your Dashboard page, right above your portfolio value chart:

This will download a spreadsheet with your portfolio values, number of trades, and your rank for each day you were in your current contest.

Getting Historical Prices For Stocks (Copy And Pasting Data In To A Spreadsheet)

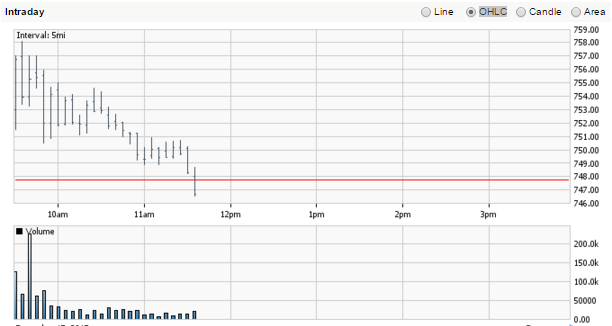
For this example, we want to get the historical prices for a stock so we can look at how the price has been moving over time. First, a new blank spreadsheet in Excel.

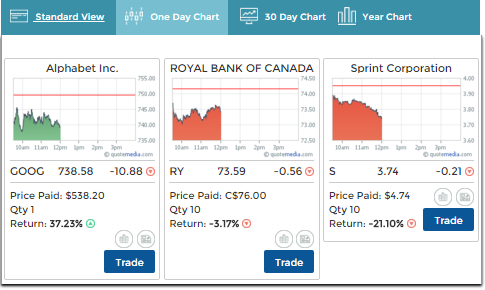
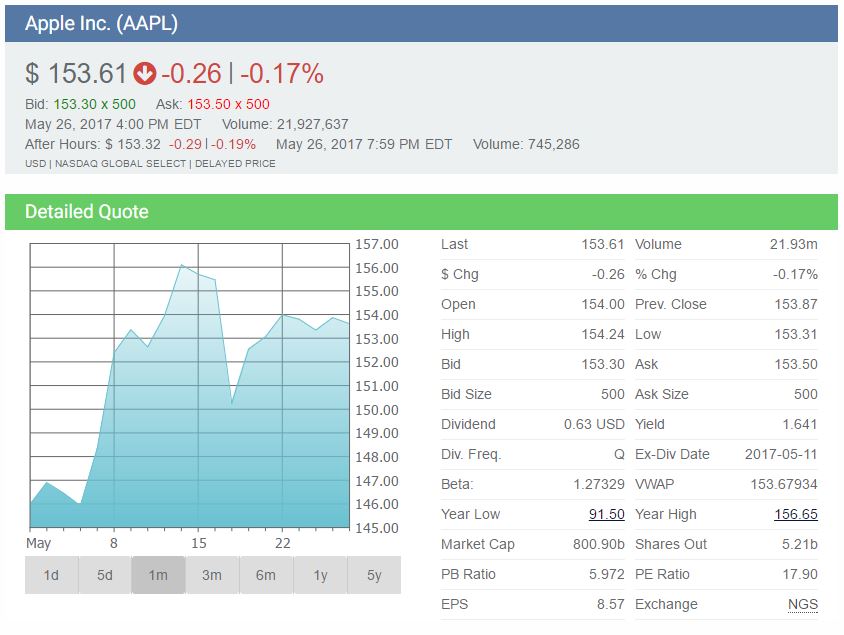
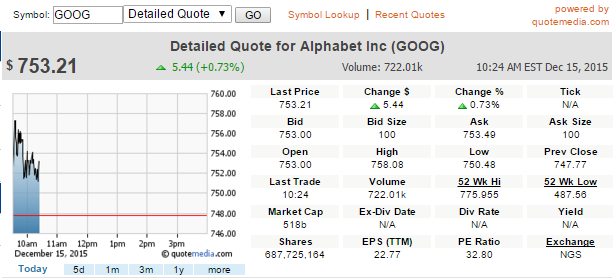
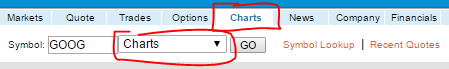
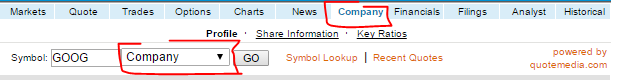
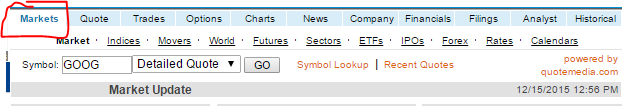
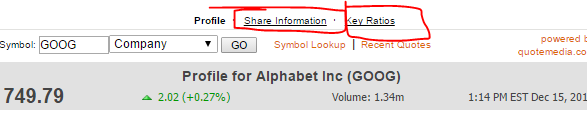
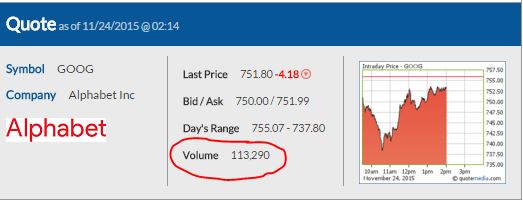
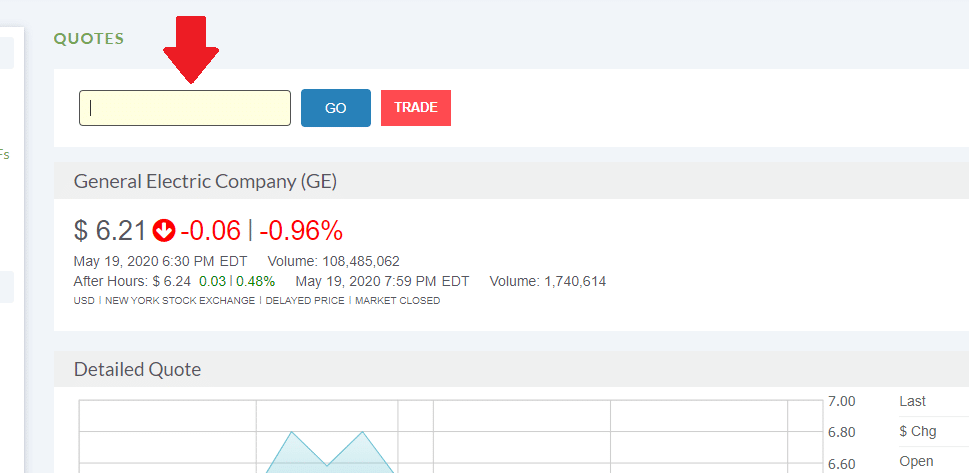
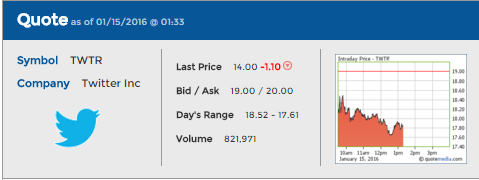
We will use Sprint stock (symbol: S). Go to the quotes page and search for S:

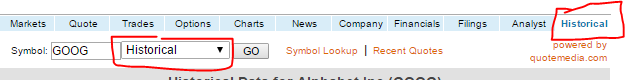
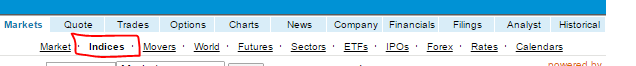
Next, click the “Historical” tab at the top right of the quote:

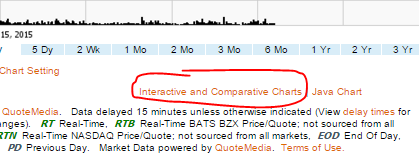
Next, change the “Start” and “End” dates to the time you want to look at. For this example, we will use the same dates that we saved for our portfolio values, January 11 through January 15, 2016.

Once you load the historical prices, highlight everything from “Date” to the last number under “Adj. Close” (it should look like this):


Now copy the data, select cell A1 in your blank excel spreadsheet, and paste.

Congratulations, we have now imported some data into excel! Notice that your column headings are already detected – this will be important later.

From there, there are few things we would like to change.

Changing The Order Of Your Data

First, this data is in the opposite order as our portfolio values. To get it in the same order, we want to sort this table by date, from oldest to newest. At the top menu, click on “Data“, then click “Sort“:

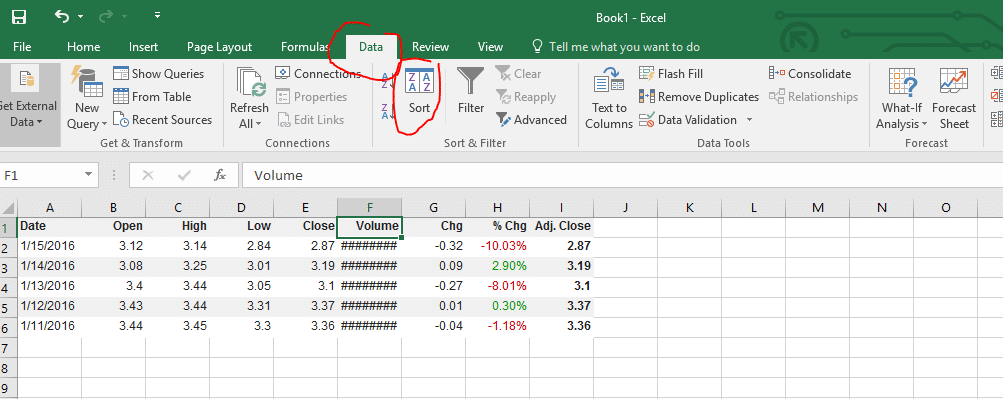
You can now choose what we want to sort by, and how to sort it. If you click the drop-down menu under “Sort By”, excel lists all the column headings it detects (select “Date“). Next, under “Order”, we want “Oldest to Newest“:


Now your data should be in the same order as your portfolio values from earlier.

Changing Column Width

Next, you’ll notice that “Volume” appears just as “########”. This is not because there is an error, the number is just too big to fit in the width of our cell. To fix this, we can increase and decrease the widths of our cells by dragging the boundaries between the rows and columns:


Tip: if you double click these borders, the cell to the left will automatically adjust its width to fit the data in it.

If you want to automatically adjust all your cells at once, at the top menu click “Format”, and “Auto Fit Column Width”:


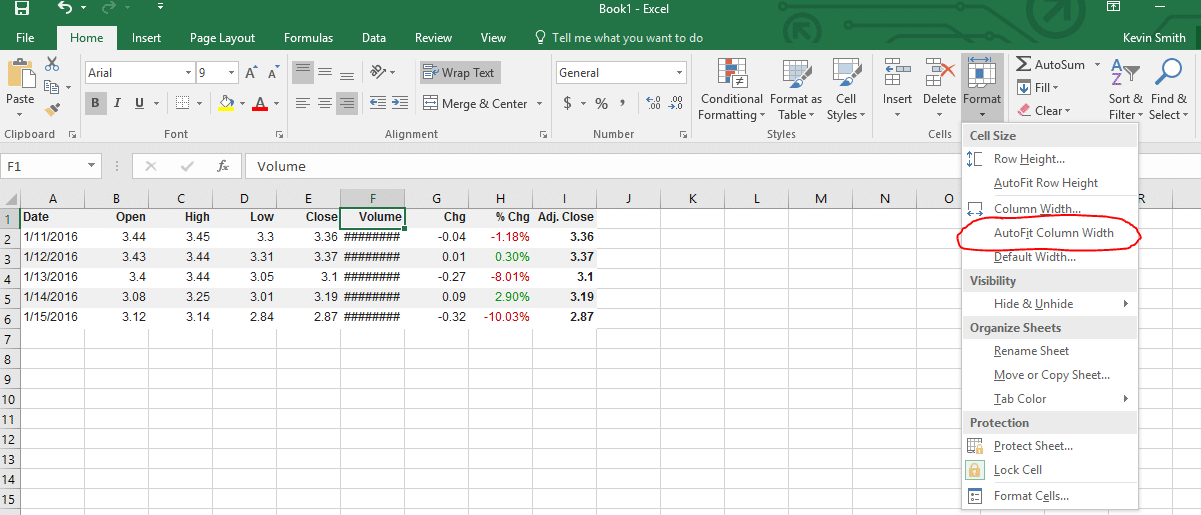
Once you’ve adjusted your volume column, everything should be visible!

Removing Columns You Don’t Need

I think that we will only want to use the Adj. Close price in the calculations we will be doing later (the “Adj. Close” price is the closing price adjusted for any splits or dividends that happened since that day). This means I want to keep the “Date” and “Adj. Close” columns, but delete the rest.

If you try to just select the data and delete it, you’ll end up with a big empty space:

Instead, click on “B” and drag all the way to “H” to select the full columns:


Now right-click and click “Delete”, and the entire rows will disappear. Now the Adj. Close will be your new column B, with no more empty space. You now have your historical price data, so save this excel file so we can come back to it later.

Getting Your Transaction History And Open Positions

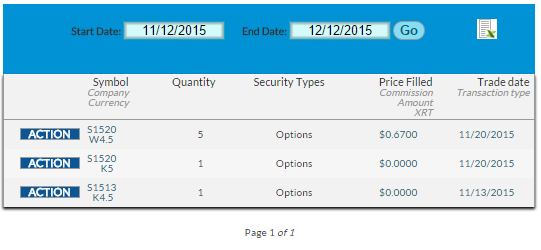
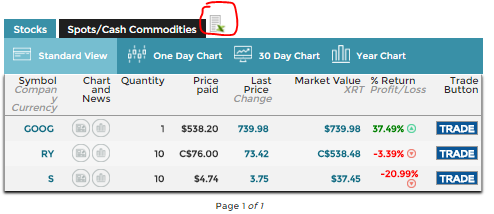
Like your historical portfolio value, we make this easy – next to your Open Positions and your Transaction History, you will find more Excel export buttons:

Regardless of the date range showing on the transaction history page, the export will pull your entire transaction history for this contest.


Using Excel To Track Your Stock Portfolio – Graphing

Now that we have some data, let’s make some graphs with it! We will go over how to make line graphs of your daily portfolio value and your portfolio percentage change, plus a bar chart showing your open positions. This is usually the most fun part of using excel to track your stock portfolio.

Line Graph – Your Daily Portfolio Value

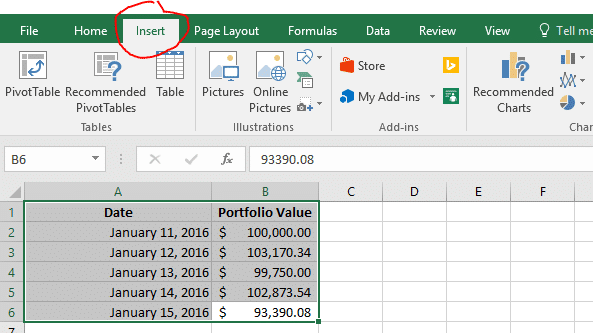
First, we want to make a line graph showing our daily portfolio value. First, open your spreadsheet that has your daily portfolio values:

Next, highlight your data, and click “Insert” on the top tab:

Here, under the “Charts” section, click on the one with lines, and choose the first “2d Line Chart“:

And that is it! Your new chart is ready for display. You can even copy the chart and paste it in to Microsoft Word to make it part of a document, or paste it into an image editor to save it as an image.

Line Graph – Portfolio Percentage Changes

Next, we want to make a graph showing how much our portfolio has changed every day. To do this, first we need to actually calculate it.

Doing calculations in Excel

In the next column we will calculate our daily portfolio percentage change. First, in the next column, add the header “% Change”


Now we need to make our calculation. To calculate the percentage change each day, we want to take the difference between the most recent day’s value minus the day before, then divide that by the value of the day before:

Percentage Change = (Day 2’s Value – Day 1’s Value) / Day 1’s Value 

To do this, in cell C3 we can do some operations to make the calculation for percentage change. To enter a formula, start by typing “=”. You can use the same symbols you use when writing on paper to write your formulas, but instead of writing each number, you can just select the cells.

To calculate the percentage change we saw between day 1 and day 2, use the formula above in the C3 cell. It should look like this:


Now click on the bottom right corner of that cell and drag it to your last row with data, Excel will automatically copy the formula for each cell:

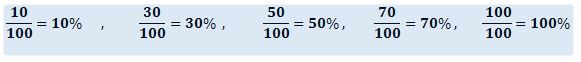
You now have your percentages! If you want them to display as percentages instead of whole numbers, click on “C” to select the entire column, then click the small percentage sign in the tools at the top of the page:


Making Your Graph With Only Certain Columns

Now we want to make a graph showing how our portfolio was changing each day, but if we try to do the same thing as before (selecting all the data and inserting a “Line Chart”, the graph doesn’t tell us very much:


This is because it is trying to show both the total portfolio value and the percentage change at the same time, but they are on a completely different scale!

To correct this, we need to change what data is showing. Right click on your graph and click “Select Data”:


This is how we decide what data is showing in the graph. Items on the left side will make our lines, items on the right will make up the items that appear on the X axis (in this case, our Dates).

Uncheck “Portfolio Value”, then click OK to update your graph:

This is closer, but now we want to move the dates back to the bottom of the graph (here they are along the “0” point of the Y axis).

To do this, right-click on the dates and select “Format Axis”:


A new menu will appear on the right side of the screen. Here, click “Labels”, then set the Label Position to “Low”.


Congratulations, your graph is now finished! You can now easily see which days your portfolio was doing great, and which days you made your losses.

Bar Chart – Seeing Your Open Positions

Next we would like to make a bar chart showing how much of our current open positions is in each stock, ETF, or Mutual Fund.

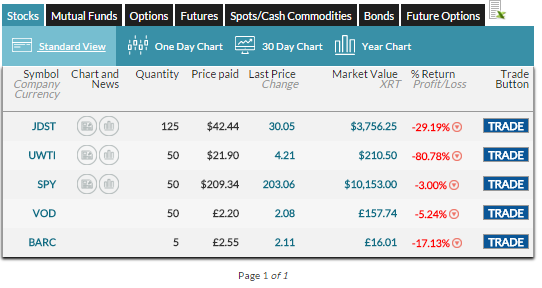
First, open your spreadsheet with your Open Positions. It should look something like this:


Since we want to make a bar chart, we can only have two columns of data. We want one column showing the symbol, and a second column showing how much it is worth. The “Total Cost” column is the current market value of these stocks, so that is the one we want to keep. However, we don’t want to delete the quantity and price, since we might want it later. Instead, select the columns you don’t want, and right-click their letter (A and C in this case). Then, select “Hide”:


Now the columns that we don’t want in our chart are hidden. We can always get them back later by going to “Format” -> “Visiblity” -> “Unhide Columns”. Now select your data and insert a “Bar Chart” instead of a “Line Chart”:


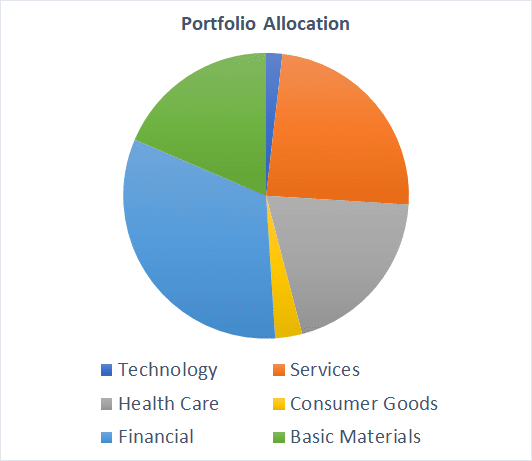
Before you’re finished, your chart will say “Total Cost”. You can change this by clicking on “Total Cost” and editing to say whatever you would like (like “Portfolio Allocation”):

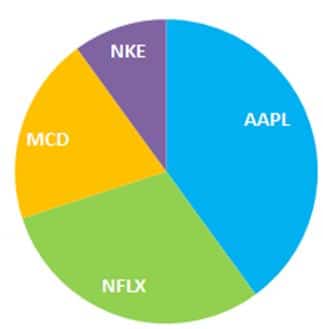
This graph is now finished, but you can also try changing the Chart Type to try to get a Pie Chart. First, right click your graph and select “Change Chart Type”:


Next, find the “Pie” charts, and pick whichever chart you like the best.

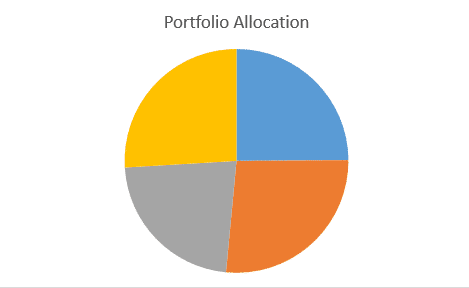
Last, now we don’t know which piece of the pie represents which stock. To add this information, click your pie chart, then at the top of the page click “Design”. Then select any of the options to change how your pie chart looks.

Congratulations, you’ve converted your bar chart into a pie chart! This one should look almost the same as the one you have on the right side of your Open Positions page.

Using Excel To Track Your Stock Portfolio – Calculating The Profit And Loss Of Your Trades

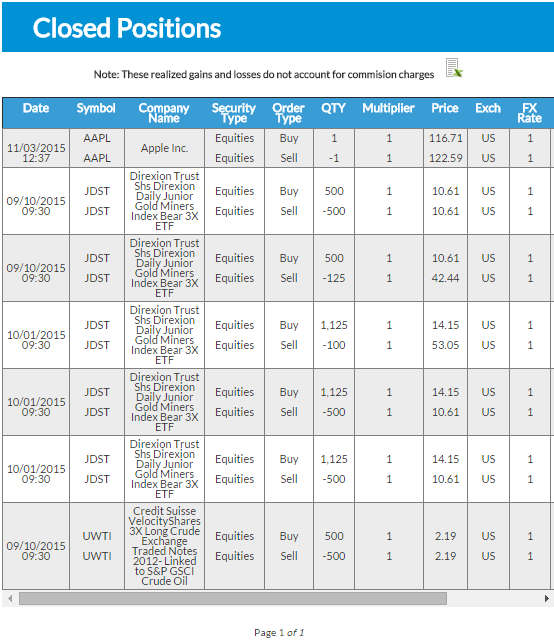
The most important reason you would want to use excel to track your stock portfolio is trying to calculate your profit and loss from each trade. To do this, open the spreadsheet with your transaction history. It should look something like this:


Tip: If you have not bought and then sold a stock, you can’t calculate how much profit you’ve made on the trade.

First, we want to change how the data is sorted so we can group all the trades of the same symbol together. Use the “Sort” tool to sort first by “Ticker”, next by “Date” (oldest to newest).


For DWTI and SPY, we haven’t ever “closed” our positions (selling a stock you bought, or covering a stock you short), so we cannot calculate a profit or loss. For now, hide those rows.

Now we’re ready to calculate! Lets start with the trade for S. This one is easy because the shares I sold equal the shares I bought. This means if we just add the “Total Amount”, it will tell us the exact profit or loss we made on the trade.


This does not work for UWTI, because I sold a different number of shares than I bought. This means that I need to first calculate the total cost of the shares I sold, then I can use that to determine my profit.

First: multiply your purchase price times the number of shares you sold:


Second: add this number to the “Total Amount” from when you sold your shares.


Now you have your profit or loss for this trade. Note: this is the method for if you bought more shares than you sold – if you bought shares at different prices, then sell them later, you’ll need to calculate your Average Cost to use in your calculation.

Pop Quiz

[qsm quiz=52]

Definition

“Major Economic Indicators” are numbers that you can look at to try to get a picture of how well the economy is doing. Different indicators measure different parts of the economy, but their main characteristic is that they measure the same thing in the same way over time. This means that you can compare the indicators from one month, quarter, or year to each other to see if the statistic you’re interested in as improved for declined over time.

Major Economic Indicators Measuring Output

Gross Domestic Product – GDP

major economic indicators - GDP

US GDP from 1947 – 2015 (Source: St. Louis Federal Reserve Bank)

Gross Domestic Product, or GDP, is the measure of how many finished goods and services were produced in a country over the course of a year. This is the biggest estimator of how the economy as a whole is doing – the total value of everything that was produced, ready for consumption.

The fact that it only measures finished products is important – this means that goods that are produced to be added to a different product later are not counted. An example of this is raw steel that is later used to build a car is not counted as part of GDP, but the car itself is.

Purchase Power Parity – PPP

If you want to compare the GDP between countries, just taking the GDP from each country and multiplying by the exchange rate will not give the full picture. In Russia right now, a Big Mac costs 114 Rubles, which is only $1.53, or about 1/3 the US price ($4). To get a true measure of GDP, we want to measure the value of production “Apples to Apples”, meaning a Big Mac produced in the United States should be counting as the same value as a Big Mac produced in Russia. The Purchase Power Parity measure of GDP tries to do this, and the Big Mac Index used by the Economist is a simple example.

GDP measured with PPP says that the Big Mac produced in the USA and Russia are both worth the same amount ($4 US Dollars).

Per Capita GDP

Even when we take the GDP at PPP, we still are not really comparing how much “stronger” one economy is compared to others. An example of this is comparing the United States to China – the United States had $16,770,000,000 in GDP in 2013, while China had a GDP (PPP) of $9,240,000,000. However, this does not mean that American workers were producing 1.8 times that of Chinese workers, since this does not account for population.

Per Capita GDP is just that – dividing the GDP at PPP by a country’s population. The Per Capita GDP of the United States in 2013 was $53,041.89, while the Per Capita GDP (PPP) of China was $6,807.43 – meaning for each person in the country, the United States was producing 7.79 times as much!

Gross Output – GO

major economic indicators - GO

Gross Output – GO – 2005 – 2015

Gross Output is a new measure – just started to be taken in 2005 in the United States, that instead measures the total industrial output, including the “middle stages” of production (the raw steel and the car are both counted).

Gross Output is an important secondary measure, like the other side of GDP. One way to think about it is that GO measures the “Make” economy, while GDP measures the “Use” economy – you should look at both to get a complete picture.

This major economic indicator is fairly new, which means it is not accurately measured in most other countries yet, so it is less common to see PPP or Per Capita numbers of Gross Output.

Major Economic Indicators Measuring Prices

Inflation is the process where money is worth “less” over time. With the same Big Mac example, the sandwich costs $4 today, but was $2.32 in 1995. When we want to compare GDP, incomes, or prices across time periods, we need to control for the differences in prices and inflation.

Consumer Price Index (CPI)

The Consumer Price Index, or CPI, is the most common measurement of inflation in the United States. CPI tries to measure how much prices for the same goods is changing over time. This is done by using a “market basket” of goods – a long list of things that researchers go out and find the prices for every year, and then take the average change. For example, the cost of bread might go up by $0.05, but the cost of a flat screen TV goes down by $50. CPI researchers use a complex system to balance out price changes by how much of each item a “typical household” buys in a year, and the result is what is considered the inflation rate.

This works well when comparing prices from one year to the next, but some problems come up when comparing years that are far apart, because the “market basket” might not be changing even though what people are actually buying does. To fix this, researchers ask 14,000 families every 10 years to keep detailed records of everything they buy for 3 months. It then uses these purchases as the basis for a new “market basket”.

Producer Price Index (PPI)

The Producer Price Index, or PPI, is the other side to CPI, how the prices are changing for producers. Like CPI, PPI measures a “basket” of goods used in production. These measures are things like coal and scrap iron, as well as other intermediate goods. For example, the cost that a tire company charges a car manufacturer for a bulk order of tires could be part of the Producer Price Index.

Since the “intermediate” goods are all wholesale, or from one manufacturer to another, the PPI used to be called the “Wholesale Index”. The PPI also has a problem with its measurement – because the economy is constantly evolving, the intermediate goods that are part of the measurement are also always changing, but these changes might not be reflected in the PPI measurement.

Employment Cost Index (ECI)

The ECI tries to measure how much the cost of labor moves over time. This measures the pay for all employees in the United States, along with other compensation costs (like health insurance and pension plans). Measuring how the ECI moves compared to the CPI can give some indication if workers are getting “richer” or “poorer”.

major economic indicators - cpi eci

Major Economic Indicators Measuring Labor

Measuring jobs is important – everyone’s eyes are always on the unemployment rates and how many jobs are created every year. However, it is important to remember what exactly these rates are so you know how to interpret them.

Unemployment Rate

The unemployment rate measures the total percentage of the active workforce that currently doesn’t have a job. This might sound simple, but it can be fairly complicated.

For example, the “Active Workforce” is anyone between the ages of 16 and 65 who is either working and is actively looking for a job, which is measured by a survey asking people how many hours they looked for a job in the last week. This means if someone does not have a job, but was visiting family last week, they are not counted as “unemployed”. This also means that workers who have temporarily given up looking for a job because they have been looking for so long without any luck are also not counted as “unemployed (these people are called “discouraged workers”). Anyone over 65 who still is looking for a job is also not counted. These last three groups together are called “marginally attached”.

Another important factor is that if you have a job, but you’re looking for a new one, you are not counted either. This means that if you can find a part-time job working for 3 hours a week, you are not counted as unemployed (you are counted as “working part time for economic reasons”). When you add “marginally attached” and “working part time for economic reasons”, the group of people looking for a job can double:

unemployment rate

Payroll Employment

employment ratePayroll Employment measures how many people are working on salary, plus how the average amount of hours the average hourly employee is working. The movement in payroll employment tells us how many jobs have been created. This is important because when the economy starts to improve, many “marginally attached” workers will re-join the “active workforce”, which means the unemployment rate can go up even if more jobs are being created. Looking at payroll employment, and comparing it with the unemployment rate, can give a much stronger picture of how the labor market is moving.

Productivity

productivity
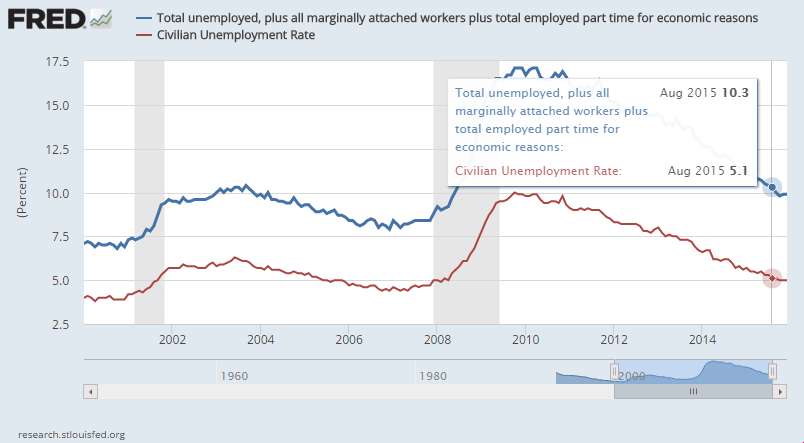
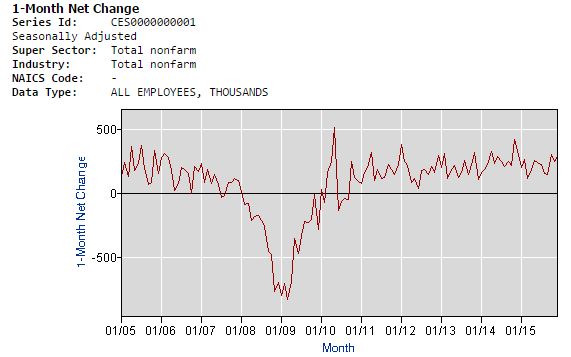
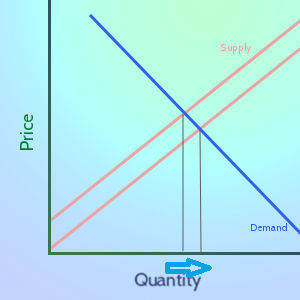
“Productivity” is a major economic indicator that measures how much each worker is producing. As workers produce more, they become more valuable. However, when a company suddenly lays off many workers, this can also increase productivity. The reason is that the remaining workers might be working harder because they are afraid to lose their jobs, or because the people who are laid off are usually the least productive (the employees that companies can “afford to lose” the most).

This means that a spike in productivity during a recession is probably a bad sign (the graph on the right show a huge boost in 2009 and 2010, when workers were being laid off in the recession), but a spike in productivity during an expansion is a sign that the economy is growing strongly.

Getting Data On Major Economic Indicators

These are the best places to get data on these indicators:

St. Louis Federal Reserve Bank Economic Research Center (http://research.stlouisfed.org) – Interactive graphs for thousands of data series, you can build your own charts from nearly any set of economic data you want! All data series is also exportable to excel.

US Department of Commerce Bureau of Economic Analysis (BEA) (http://www.bea.gov) – The research organization that builds GDP and production data for the United States, some interactive tables but most data is for export to excel.

Department of Labor Bureau of Labor Statistics (BLS) (http://www.bls.gov) – Research organization that gathers price and employment data for the United States, many quick tables and data you can export to excel.

World Bank Open Data (http://data.worldbank.org) – Excellent resource for getting major economic indicators from nearly every country around the world. This has less diverse data for the US than the other two sources, but is great for general indicators.

The Economist’s Big Mac Index (http://www.economist.com/content/big-mac-index) – This is a great tool to get a rough estimation on Purchase Power Parity across hundreds of countries around the world, and shows currency exchange rates in comparison, with an interactive map.

Pop Quiz

[qsm quiz=67]

The stock market determines prices by constantly-shifting movements in the supply and demand for stocks. The price and quantity where supply are equal is called “Market Equilibrium”, and one major role of stock exchanges is to help facilitate this balance. We can use the stock market to give some great supply and demand examples with buyers and sellers who want different prices.

Supply of Stock

Click Here for our full article on Supply

“Supply” refers to the total number of stock holders who would be willing to sell their shares at any price. For example, lets say we have 10 shareholders, each of which would be willing to sell their share at a certain price:

Current Sellers

All these sellers “value” their share differently. The shareholders on the left would be willing to take a much lower price for their shares than the sellers on the right. If we look at the whole market for shares, as the price goes up, the total number of shares “supplied” also goes up:

Supply Line

At a market price of $10, only 1 share will be supplied, but at a price of $25, 5 shares would be supplied.

Demand For Stock

Click Here for our full article on Demand

“Demand” refers to the total amount of stock potential buyers would be willing to buy at any price. We can use a similar example to the one above – imagine we have 10 people who want to buy 1 share each, but are only willing to pay a certain price:

Potential Buyers

Unlike supply, this means that as the price goes up, fewer people are willing to buy a share. For example, if the price per share was $30, only 4 people would be willing to buy (the 4 on the right side) who would be willing to pay $30 or more). If we look at the total demand as a graph, it slopes downwards:

demand line

Market Equilibrium

“Market Equilibrium” is the point where the supply and demand meet – all the potential buyers and sellers trade until there is no-one left who agrees on price. In a graph, you can see the equilibrium point as where the supply and demand meet.

With our example of buyers and sellers, we can see the exact point where the market reaches equilibrium:

Market Equilibrium

At a price of $27 (actually anywhere between $25.50 and $27.50) and a quantity of 5, the supply equals demand and the market is balanced. From a practical standpoint, these are the buyers and sellers who made a trade:

share supply 3supply and demand examples - equilibirum price

The buyers who wanted the stock the most, and the sellers who were the most eager to get rid of it, made their trade. For the other buyers, no seller was willing to sell their stock low enough for them to want to buy.

The next-lowest seller wants $28 for their stock, but the next-highest buyer will only pay $25, so no more trades will happen.

Efficient Equilibrium

This example makes sense, but why didn’t we have 8 trades instead of 5? If all the highest and lowest buyers and sellers were linked directly, a lot more trades could take place.

supply and demand examples - direct trading

Unfortunately, there are some big problems with this. The biggest problem is information: the lowest seller, who sold for somewhere between $10 and $12, can now see that someone else just sold their share for over $35 – all the sellers would only try to sell to the highest buyers, and all the buyers would only try to buy from the lowest sellers.

Producer, Consumer, and Total Surplus

If the potential buyer who is willing to pay $38 wants to make a good deal, they will first try to buy from the person who only wants $10. This way they start with an extra value of $28 – the difference between how much they were willing to pay and how much they actually had to pay. We call this bonus the “Consumer Surplus”:

Consumer Surplus = Highest Price a buyer is willing to pay – Price they actually pay

On the other side, the sellers want to make the most profit they can, so the seller who would take $10 at the minimum would much rather sell to the high buyer for $38, making themselves an extra $28. We call this bonus the “Producer Surplus”:

Producer Surplus = Price a seller actually sells an item for – Lowest price they would sell for

However, we can’t have it both ways. Since the buyer and seller both don’t want to lose out, there will be negotiations and the final sale price will fall somewhere in the middle. In a good system, we will get the maximum amount of these “bonuses” as possible – we want the biggest Total Surplus. We call the pricing and trading system that gives the most total surplus “Efficient”.

Total Surplus = Consumer Surplus + Producer Surplus

Lets compare the two trading systems – the one where the most number of trades happen (but every trade has a different price) with the one where supply and demand are equal at one price. We will assume that the buyers and sellers in the first system are paying the average of their two prices, and splitting the surplus evenly.

surplus with variable prices

Total surplus when all trades have different prices

Now let’s compare this to the system where everyone is trading at the same price:

total surplus

Total surplus where everyone pays the same price

The total surplus under this system is $73 – nearly 3 times as high!

Supply And Demand Examples – Making Trades For The Most Surplus

This might be good for the people who made their trades, but it is also important to see how these prices are found in the first place.

Think of it like all the buyers and sellers are making limit orders – sellers are setting a “Limit Sell” order at their prices, and the buyers are setting “Limit Buy” orders at their prices (Click Here for our full article on Limit Orders).

In the example with the most trades taking place, the stock exchange is taking all the lowest limit buy orders and pairing them with the lowest limit sell orders to make the most trades happen. However, this system can never be fully fair to all the buyers and sellers. Look at the image showing who made their trades in this system – the buyer who would have been willing to pay $14 doesn’t get to buy anything, but the buyer who was willing to pay $12 did. The seller would obviously rather sell to the person offering $14 than the person offering $12 too.

This means that for both one buyer and one seller, a better trade could be made, increasing the Total Surplus, so these buyers and sellers would be better off making their deal outside the stock exchange entirely so they can get a bigger boost.

However, lets go back to our $38 buyer and our $10 seller – both of these would also be better off making a deal with each other outside the stock exchange, since they could settle at a price between their values and have a huge surplus to split with each other. This will happen again with the $15 seller and $34 buyer – they are both making a bigger surplus by buying with each other and abandoning their limit prices entirely. Since the highest buyers and the lowest sellers are pairing off to make their own deals, the lower buyers and the higher sellers no longer have a partner willing to take their price – we arrive back to the same Supply and Demand system where all the trading is done at around the same price as we had for our equilibrium, and with the same Total Surplus.

The average price is $25.70, which was in the range of the equilibrium price we found above

The average price is $25.70, which was in the range of the equilibrium price we found above

supply and demand auction surplus

Supply And Demand Examples – Bid And Ask Prices

This instead makes a system of Bidders and Askers – when you get a quote on a trading platform, you’re seeing the most the highest buyer is willing to pay as the Bid Price, and the least a seller is willing to sell for as the Ask Price.

supply and demand example with twitter

This is an example of a quote for Twitter (symbol: TWTR). There are three prices shown – the Bid Price, the Ask Price, and the Last Price, and this is the exact situation we have already seen with our buyers and sellers above!

The “Last Price” tells us what happened the last time a buyer and seller agreed on a price – they traded at $25.70.

The “Ask Price” tells us how much the next-lowest seller wants for their share – he wants at least $28.00

The “Bid Price” tells us how much the next-highest buyer would be willing to pay for a share – he will pay up to $25.00.

This also impacts you when trading – if you’re trying to buy stock with a “Market Order“, you will get the “Ask Price”, or how much the current sellers want for their stock. If you try to sell with a Market Order, you will get the “Bid Price”, or how much current buyers would be willing to pay for your shares.

Pop Quiz

[qsm quiz=63]

Definition

In Economics, “Demand” is the relationship between prices and how much people want to buy a good or service.

Details

Demand line
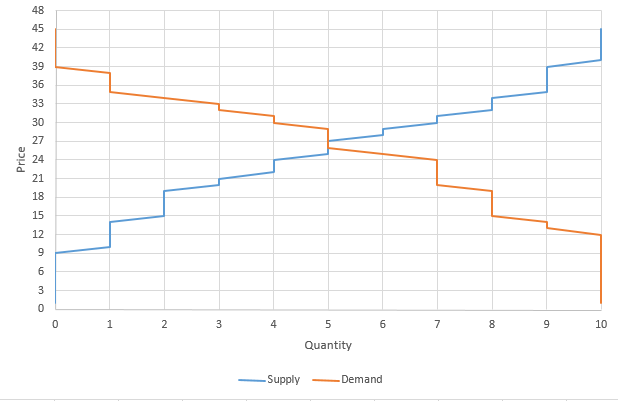
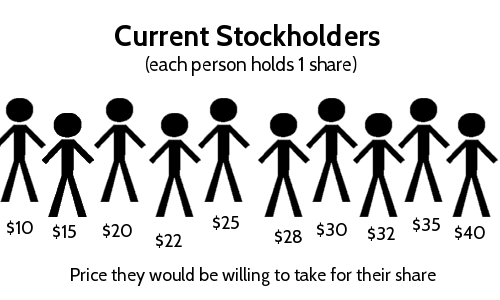
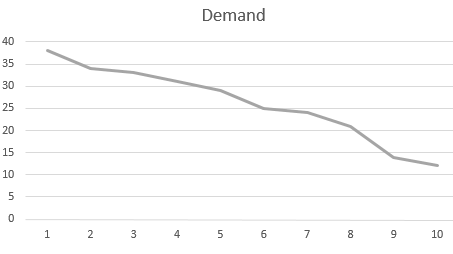
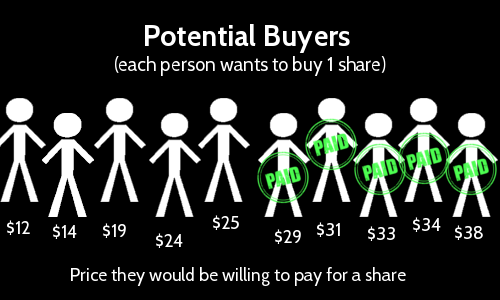
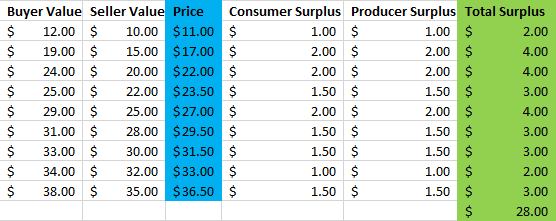
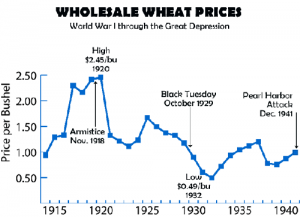
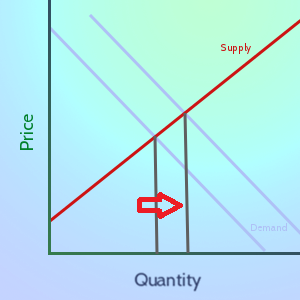
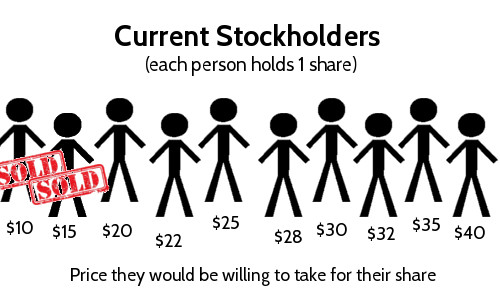
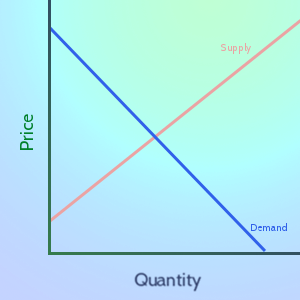
As the market price of a good goes up, the amount of that good that people are willing to pay generally goes down. This is because each person puts some value on the good – if the price is higher than the amount a person values it, they will not buy it.

However, notice on the graph on the right that at a price of 0, there is still a maximum people are willing to take. For example, even if oranges were free, you still wouldn’t take home a truck full of them – they would rot before you had a chance to eat them. The opposite is also true – the price can get so high that nobody is willing to buy, and the quantity demanded is zero.

Difference Between Demand And Quantity Demanded

“Demand” refers to the relationship between the price and quantity – in our graphs, the “Demand” is the entire blue line. The quantity demanded is a single point on that line.

This means that a change in “Demand” means the entire line has moved, while a change in the “quantity demanded” means the quantity has moved to a different point on the same line (due to a change in Supply).

demand shift

Increase in Demand

demand q increase

Increase in Quantity Demanded

An increase in demand can come from many places. The biggest is called an increase in “consumer tastes and preferences”, where a product becomes more “in style” or consumers become more aware of it. This can sometimes be the result of a marketing campaign.

An increase in demand can also come from a similar product changing price. For example, if ketchup and mustard suddenly become lower in price, the demand for hot dogs and hamburgers could increase as a result. Another impact could be a general increase of income – if all people are making a bit more money than they were before, they have more to spend and so demand more goods and services.

The quantity demanded, however, will move because of both shifts in supply and shifts in demand. If Demand shifts up, it means a higher quantity of a good is demanded at the same price as before (see the left graph above). If supply increases (like the graph on the right), the quantity demanded will also go up.

Examples With The Stock Market

The stock market is a great place to see how demand and the quantity demanded changes in action.

If you are thinking about buying a stock, you are part of the “Demand” for that stock. At what price you’re willing to buy, and how many shares, is your current demand.

Imagine there is a stock that 10 people want to buy a share of. Each of them has a “maximum price”, meaning the most they would be willing to pay for a single share based on how much they think that stock is worth.

Demanding customers

Then this would be the demand line for this market:

demand line

The actual quantity demanded is dependent on what price producers are willing to sell at. Let’s consider a real example – what if all these people wanted to buy Twitter stock (symbol: TWTR)? We can find out by getting a quote from the Trade page:

twitter2

This quote can tell us about the demand, and what would happen in this case. The “Last Price” is $14 – that is because that is the most the last buyer was willing to pay to buy a share.

share demand2

We can look at the “Bid / Ask” price to know how much the closest buyers and sellers are to each other – we can see that our buyer with the next-highest value, the person who would buy the stock at $19, is the current highest “bidder”. However, the next-lowest seller wants at least $20 (the “Ask” price), so a trade is not made.

This means that for today, the quantity demanded is 8.

Pop Quiz

[qsm quiz=51]

Definition

In Economics, “Supply” means the relationship between prices and production. In general, the higher the market price of a good or service is, the more producers are willing to sell of it.

Details

Supply Line
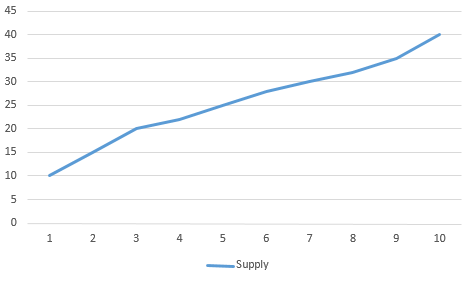
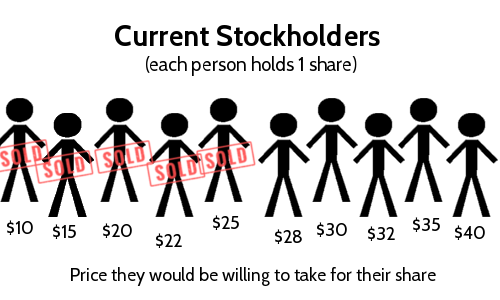
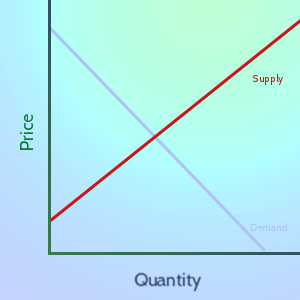
As the market price for a good goes up, companies want to sell more of it to try to make greater profits. Conversely, as the market price goes down, companies are less interested in production, and so the quantity supplied generally goes down.

Take a look at the graph on the right – notice that the “Quantity” does not start going up until the “price” gets above a certain point. This is because companies will not start producing something until the market price is at least as high as the cost of making it. As the market price goes up, the potential for profit also goes up, so companies are willing to put more resources into the production of this good, and the quantity supplied increases.

Difference Between “Supply” and “Quantity Supplied”

“Supply” refers to the relationship between the price and quantity – in our graphs, the “Supply” means the entire red line. The quantity supplied is a single point on that line.

This means that a change in “supply” means the entire line has moved, while a change in the “quantity supplied” means that the quantity has moved to a different point on the same line (due to a change in Demand).

supply shift

Increase in Supply

Increase in Quantity Supplied

Increase in Quantity Supplied

An increase in Supply usually means there was a fundamental shift in how the good is produced. A new manufacturing technique that saves on cost, subsidies from the government, or the cost of inputs becoming cheaper can all cause an increase in supply.

In contrast, new government regulations, an increase in the cost of inputs, or increased wages for workers (assuming they do not become more productive) will all cause supply to decrease.

The Quantity Supplied, on the other hand, can move because of both shifts in Supply and Demand. As you can see on the graphs above, an increase in supply will cause the price to decrease and the quantity supplied to increase, even if demand does not increase.

However, if demand increases (meaning more goods are demanded at the same price), the quantity supplied will also increase, even though the supply line itself stays the same.

Examples With The Stock Market

The stock market is a perfect example of seeing both changes in Supply and changes in Quantity Supplied in action.

Imagine there is a stock that 10 people currently own. Each of them has a price they would sell their stock for, if someone offered.

share supply 1

This would then be the supply line for this market:

supply line example

The actual quantity supplied will depend on what price buyers are willing to pay. Now lets consider a real example – what if all of these people had a share of Twitter stock (symbol: TWTR)? We can find out by getting a quote from the Trade page:

twitter

This quote tells us a lot about the supply, and what would happen in this case. The “Last Price” is $15 – that is because the market price was high enough for our lowest two suppliers to sell their share.

share supply 2

If we look at the “Bid/Ask”, we can also see that the most a buyer is willing to pay (the “bid” price) is now $17.89. We also see that the “Ask” price is now $20, which is the lowest amount that a seller is willing to take for their share.

This means for today at the market equilibrium price, the quantity supplied is 2.


Pop Quiz

[qsm quiz=50]

Comparing Economic Systems

There are many different economic systems that try to result in more equality or faster growth. The structure of a country’s economy has a lot to do with the country’s politics and the values of its population. However, the economy of every country also changes over time, and how it falls between these broad categories will often change with it.

Market Economies

“Market Economies” are economic systems where production is determined by a system of prices and profits. This is also called the laws of Supply and Demand. These economies are subject to relatively little direct control by a government or economic planner, allowing people and businesses to try to distribute resources to maximize wealth. Market economies also have a certain level of income inequality. This is partially because profit is a large motivator behind how resources are allocated, higher profits and higher income usually result in higher income compared to everyone else.

Capitalism

Money and profits
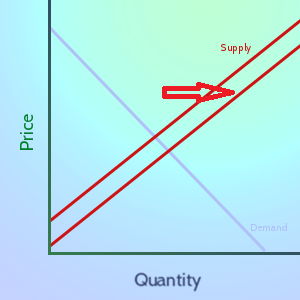
Capitalism is a type of Market Economic System. Under a pure capitalist economy, there is little or no direct government regulation of the economies. Instead, the economy is regulated by the “invisible hand” of the markets. Companies that are inefficient or unpopular simply lose business to their competition. This should give companies incentive to always innovate. This also applies to the environment and business practices. If consumers do not like companies that heavily pollute or engage in worker exploitation, they will take their business to other companies. In contrast, companies that put emphasis on environmental stability would attract the business of consumers who value the environment. This also applies to prices. Companies with high prices will quickly lose business to companies with lower prices. The balance between prices and values (worker exploitation, the environment) should then reflect the population’s values as a whole.

The labor market is also dictated by the market. This means that workers get hired and are paid both according to their productivity. Their “replacement cost”, or how many other workers the firm can hire who are just as productive, is also a major factor. This gives incentives to workers to obtain new skills and renegotiate their salaries as they become more productive.

Criticisms of Capitalism

There are many movements emphasizing the problems with the capitalist economic system. One major problem is how the economy copes with large monopolies, or companies that are able to put all of their competition out of business. If a company has a monopoly, customers are not able to switch to a competitor if they do not like the company’s business practices. It also removes much of the incentive to keep prices low and to innovate.

This economic system can also be difficult for workers. If a worker starts with low skills, it can be very hard to save the time and money to build new skills to increase their income. This means that low-skill workers can be trapped with no way to increase their skills. This leads to greater income inequality as the rich can get richer because they have the means to do so. At the same time, more and more workers with low skills means that their “replacement cost” is very low, pushing wages farther down.

Market Socialism

socialism

Logo of the Socialist Party of America

“Socialism” is not a clear economic system itself, but “Market Socialism” is a form of a Market Economy that places emphasis on equality. The main characteristic is that the “means of production”, meaning factories, farms, and resources, are at least partially “collective”, meaning everyone in the economy gets some part of the ownership. However, people still decide what kind of business they want to start, and companies still decide their levels of production and what exactly to produce.

This economic system sometimes says that no companies can earn a profit. Instead, all revenue that is more than costs is distributed between everyone in the economy (called a “Social Dividend”). Other times the profit is instead distributed only to the workers in the factory which earned the profit, giving workers and managers a bigger incentive to work harder and continue to innovate. In both cases, there is an incentive to earn more profits, either for the sake of everyone in the economy or just for the workers who are earning them.

Workers in Market Socialism are paid only according to their productivity, and not their replacement cost. As part of the “Social Dividend”, workers are given some degree of ability to build new skills (sometimes including free education).

Criticisms of Market Socialism

The biggest problems with this economic system are practical. Some overseeing agency needs to be responsible to distribute the social dividend, which has a high chance of being corrupted or playing favorites. There is also a huge disagreement about how it should be distributed between the population (see: the socialist calculation debate). It is difficult to decide how much of the “profits” should be re-invested in growth and how much should be distributed back to all the workers. In a pure capitalist economic system this is determined by the “invisible hand” – companies that re-invest more generally grow more, but it does not apply in a socialist system.

There is another problem with full employment. Since workers are paid according to their production only, with no consideration of replacement cost, each worker costs more in a socialist system than a capitalist system. This means for the same production, fewer people have jobs and unemployment is higher. This also means that the profits for the same level of production will be smaller, which means less is available for re-investment. While the lowest-skilled workers will certainly be better off in a Market Socialism economic system than a pure Capitalist economic system, it is not clear if the lower re-investment and lower profits would make middle-income workers better or worse off. It is clear, however, that fewer people would be working in total, and people who are not working but are still earning a “social dividend” are not as beneficial to the economy as people who are working and producing.

Market Economies In The World

In the real world, most countries are some form of market economy (especially in North America and Europe). However, none is a full “capitalist” economic system or fully “Market Socialist”. Instead, all countries fall somewhere in the middle.

This means that even countries that call themselves “capitalist” do have controls to prevent monopolies from getting too powerful. They also do put taxes on profits and people with high incomes to pay for social programs, like unemployment benefits, universities, and environmental protection, which is a form of the “social dividend”. However, they also allow people and companies to keep profits to use as they want, and allow some level of income inequality. The balance between “capitalism” and “market socialism” does vary between countries, with some countries having higher taxes, regulations, and social benefits than others.

Command Economies

Command Economies describe economic systems where a central planning agency determines what and how much is produced. The planner also determines how much of each resource is allocated to each person in the economy. Money and currency generally play very small roles in this type of economic system.

Feudalism

russian peasants

Russian peasants in 1861. Color photo by Leo Tolstoy

Feudal economic systems describes much of the world before 1800. The primary source of economic activity is farming, with any industrial production limited to Cottage Industry. A feudal system is comprised of an elite class, making up kings, lords, and knights, ruling over a large peasant class who are responsible for farming. The peasant class usually had no rights of their own, and were not permitted to leave the estate of their lord without permission.

Profits are generally very small and are kept by the ruling classes, with re-investment limited only to what is necessary to keep the population alive and working. There may also be a merchant class that lives in cities and engages in trade, but these are the “special” cases and do not comprise a large part of the economy.

All production was determined by the lords and kings, which instructed the peasant class on what to produce. This generally was what kinds of crops to harvest, but also included the instructions to the cottage industry producers on what kind of products to make. This resulted in the most extreme income inequality, with the rich owning everything and the poor left as little more than slaves.

Feudal societies generally do not exist today, apart from some small pockets in extremely under-developed parts of the world.

Communism

communismCommunist economic systems are also known as “non-market socialism”. The factories and materials are “owned” entirely by everyone in the economy. The central planning agency determines how much of each item is produced, and who gets the finished products. For example, the central planning agency would decide how many shoes are produced, and then distribute the shoes to all the people it determines needs them the most.

People are paid a certain amount by the government, and then are allowed to buy only certain types of items. If they want something that they do not have permission to buy, they need to request permission. The central planner then takes the requests and uses them to determine which factories are producing how much of each item. Since the central planner is deciding how much of each item is being produced, they generally also choose what kinds of work people do. In theory, this is based on people’s strengths – strong, healthy workers might be manual laborers, while very smart people would be researchers. People are given a set of jobs to choose from based on what the economy needs the most of at that time.

The strength of Communism is that the central planning agency can try to distribute all resources to obtain absolute peak efficiency, producing what is needed of every item and using any extra resources for development and social benefit. The hope is that with careful planning, there will be less wasting of resources, and instead of profits being distributed, all savings goes directly towards growth. There is also strength in equality – theoretically all people are equal in a communist economic system, and prosper equally with growth.

Criticisms of Communism

Communism is generally not popular in the West because of the high value placed on individual freedoms. In a communist system, people cannot decide what kinds of companies to start, companies cannot choose their levels of investment or production, and people generally cannot decide what they can purchase. Historically, communist economic systems arose out of countries that were previously Feudal, meaning the majority of the population (the peasant class) did not previously have a history of personal freedoms to begin with. This meant that the restrictive nature of the central planning was not a new burden.

Communism is also characterized by shortages of many “popular” goods, and surpluses of “junk”. This happens because people need to ask the central planner to increase production of a good, and it can take months or years before those goods to be produced. Until the new goods are produced, it is in a shortage. If the population wants an improved version, or it has fallen out of style, by the time the goods are produced, it is “junk” by the time it comes out of the factories. This usually leads to large black markets of illegally-traded goods.

In the real world, communist economic societies also have big problems with corruption. Factory managers and workers have a high incentive to try to sell goods on the black market before sending it to the central planner, which can make the “official” shortages worse. Central planners themselves are easily corrupted, since they have the power to distribute more goods to their own friends and family. Individual workers also can have a hard time to find motivation to work harder. In a market socialist economic system, workers can be motivated both by individual profits and by the social dividend. However, in a communist system, the individual profit is removed entirely, and the social dividend does not increase by much with the extra effort of one single worker.

Command Economies In The World

Full command economies are fairly rare in the world today. An example of a purely Communist economic system is North Korea. Other countries, like Cuba, still maintain a central planning agency, but have begun to introduce more elements of market economies.

How Economic Systems Relate To Development

The paths that countries take towards development out of a Feudal-type economy based in agriculture has a lot to do with what type of economic system they use. Generally speaking, feudal economies that experience a gradual increase in strength of the Merchant classes based in cities will develop into Capitalist economies. If power is seized by the Peasant classes, either through revolution or a military coup, the economy has generally started development under Communism.

Countries that develop with capitalist economic systems eventually feel pressures from the people to add protections to prevent exploitation and control the power of monopolies. The United States would have been considered a Capitalist economic system until 1900, when laws began to be passed to limit monopoly power, enforce minimum wages, and protect the environment. These protections have become stronger over time.

By contrast, Cuba, which was a market economy until 1950, underwent a Communist revolution in large part in reaction to the extremely strong control monopolies (like the United Fruit Company).

Pop Quiz

[qsm quiz=66]

Definition

The Federal Reserve Bank, or the “Fed”, is the central banking system of the United States. It serves as the primary regulator of the US dollar, as well as the “lender of last resort” for other banks.

Regulating Currency

The Federal Reserve works to maintain the interest rates that banks use to lend money to each other – and by extension – the interest rate you would get when you take a loan out from a bank. By regulating interest rates, they work to regulate the money supply. This also gives them some control over how quickly the economy grows or shrinks, as well as inflation.

Regulating The Economy

When interest rates are low, it is “cheaper” for people and businesses to borrow money, so they will borrow more. When interest rates go up, people take out fewer loans. Generally speaking, businesses borrow money when they want to hire new people or increase their production capacity (for example, building a new factory). Most new business take out loans to cover start-up costs.

This means that if the economy starts to slow down, the Fed will lower interest rates to make it “cheaper” for companies to start up or expand. If the economy starts expanding too quickly (for example, the “Tech Bubble” in the late 1990’s), they will raise interest rates to try to slow it down.

Regulating Inflation

Inflation is what happens when prices across the economy go up – usually prices increase by about 3% a year in the United States. One reason for this is cyclical – imagine if you are running your own business. If all of the other businesses you rely on for supplies raise their prices, you need to raise yours too because of the extra costs. If you want to give your employees a raise, either because they’re doing a great job or just because you know their cost of living has gone up due to price increases, you’ll need to pay them more too.

Because of how money is created in the United States, this also means that the money supply generally will increase when interest rates are low, and generally decreases when interest rates go up. The Fed also works to maintain a stable inflation rate to prevent prices across the economy from raising too quickly.

Research

The Federal Reserve Bank is also the biggest economic research organization in the world, employing an army of researchers investigating everything from economic development to the effects of new currencies on our current money supply. If you want more information on some of the research from the Federal Reserve, or to access some of the economic data they collect (like GDP), you can visit the St. Louis Federal Reserve Economic Data page by Clicking Here.

The Federal Reserve System

Branches

The Federal Reserve Bank is divided into 12 “Branches”, each responsible for their own territory. The branches are:

  • Atlanta
  • Boston
  • Chicago
  • Cleveland
  • Dallas
  • Kansas City
  • Minneapolis
  • New York
  • Philadelphia
  • Richmond
  • San Francisco
  • St. Louis

The branches are distributed according to how the nation’s economic activity looked in 1913 (when the Fed was created) – the Northeast with a greater concentration, with the plains area very spread out. Missouri is the only state to have two Fed branches, mostly due to the fact that a senator from Missouri, James A. Reed, was instrumental in getting the law that created it to pass the Senate.

Some of the branches serve special functions – for example, the Federal Open Market Committee, which determines US monetary policy, is led by the President of the Federal Reserve Bank in New York (with other Fed branches rotating on 5 other positions on the committee).

New York Federal Reserve Bank Gold Vault
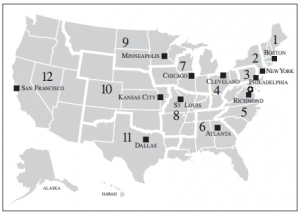
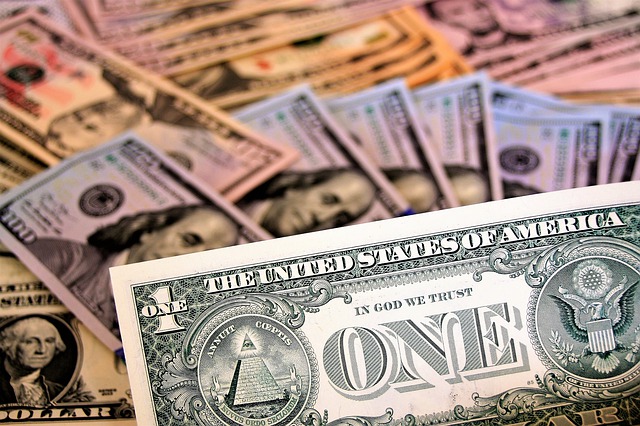
The New York Federal Reserve Bank also has the world’s largest gold storage facility. Over 95% of the gold stored here is from other countries as part of their own currency reserves, making up about 10% of all the world’s gold reserves. Countries keep the gold stored at the Federal Reserve for practical reasons – if countries need to trade gold between each other, it is easier to move it from one vault to another within the same facility than to ship it between countries.

Relationships With Commercial Banks

All banks in the United States are required to have a “reserve requirement“, meaning a percentage of deposits available for withdraw and not loaned out. Banks can either keep this as cash stored in the bank vault, or (much more commonly) deposited at the Federal Reserve Bank.

If a bank does not have enough cash to satisfy its reserve requirement at the end of the day, they need to make loans from other banks, or the Federal Reserve itself, and deposit the borrowed money. This function is why the Federal Reserve Bank is sometimes called the “lender of last resort”, and the interest that is charged for these overnight loans is called the “overnight rate.”

Pop Quiz

[qsm quiz=64]

Definition

The Reserve Requirement is how much of all deposits that a bank is required to keep “on hand”, meaning in its vaults, or on deposit at the Federal Reserve Bank (in the United States).

Details

The “Reserve Requirement” is about 10% of all money that has been deposited at a bank. Because of how money is created (click here for our article about How Money Is Created), banks will use deposits to make loans to people and businesses. The Reserve Requirement was first created to put a limit on how far banks can “multiply” each deposit.

The reserve requirement was much more important a hundred years ago. Back then, it was needed to make sure banks had enough cash for all the people who needed to withdraw money at any time.

Before the invention of the Federal Deposit Insurance Corporation (FDIC), depositing money at a bank could be very risky. Banks would use deposits to make loans, just like they do today. If too many people and businesses were unable to pay their loans back, it could mean the bank would go “bankrupt”, and your savings would be lost.

This meant that every time a financial crisis took place, panicked savers would rush to their bank to demand all their savings back before the bank ran out of cash. This is called a “run on the bank”, and often otherwise stable banks would be ruined under the weight of all depositors arriving to demand all of their cash back at the same time. The Reserve Requirement was created to help prevent this – savers knew that no matter what, a certain percentage of deposits would be stored in the bank vaults, not lended out, so there was less reason to run to the bank during economic instability.

Definition

The stock market crash of 1929 was a massive crash in stock prices on the New York Stock Exchange, and marks the largest financial crash in the United States.

Details

wall street during the stock market crash
Wall Street during the crash

The stock market crash came in multiple parts – the initial crash on October 28 (a 12.87% drop) continued into October 29 (a 11.73% drop), but prices continued to decline until 1932, with a total loss of 89%. The crash marked the start of, and is one of the major causes of, the Great Depression.

Initially, some of the most wealthy bankers and industrialists tried to halt the crash by buying up millions of dollars in stocks themselves to try to boost prices. On the first day of the crash, the heads of several of the biggest banks in New York pooled their resources to buy huge amounts of US Steel (Stock Symbol: X) and other Blue Chip stocks. After this gesture, the panic began to subside and prices stopped dropping for the day.

However, the next morning prices resumed their fall, and further huge purchases by the Rockefeller family, and many others, were unable to restore investor confidence. Many people had been using stocks as collateral for loans they had taken out at banks – when the stock value dropped, the banks would often ask people and businesses to repay their loans, causing a massive wave of bankruptcies. This is how the crash in stock prices spread to the economy as a whole.

Causes Of The Stock Market Crash

There are several main causes of the 1929 stock market crash, ranging from wheat farmers through investment bankers and all points in between.

Millions Of New Investors Entering The Market

before the stock market crash
New investors on Wall Street in 1918

After World War One, millions of Americans began moving to the cities looking for work, and a new middle class began to emerge from the prosperity that followed the end of the war. This new group of people wanted effective ways to save their money and secure a more profitable return than simply keeping it in a savings account. Generally speaking, they chose to invest in stocks.

Today, this would not be much of an issue, but before the 20th century most investing was in bonds. The transition to stock trading came about because of railroad companies and new industrial companies. This new middle class was also buying cars and houses, which as good for business for steel and construction companies. This made their stock price rise.

This was the first time that small investors were buying stocks in a large scale (before the 1920’s, buying stocks was usually done only by the wealthy), and they generally were buying companies that they already saw the prices rising for to try to secure the highest return. The P/E ratio (the stock’s price divided by its earnings – per – share was extremely high compared to what is normally seen today).

When the stock market crash started, it knocked most of these new investors out of the market completely – they were forced to sell their shares and lost all of their savings. This meant that there were fewer investors available to buy stocks and help start a recovery.

Crash In Wheat Prices

wheat prices before the stock market crash
Wheat prices between World War 1 and World War 2. Source: u-s-history.com

The year before the stock market crash, American farmers produced record amounts of wheat, so much that it was not all sold by the end of the year. In 1929, wheat prices started to fall as the suppliers were struggling to sell off their reserves as the new harvests came in. Countries like France and Italy were also having huge harvests, so it was not possible to get rid of the extra supply by exporting it, but in 1929 the American harvest was also lower than the previous year.

This meant that farmers who were already facing very low prices now also had less wheat to sell, which caused many farms to fail. Back at this time, a large amount of the US economy was still based on agriculture – from industrial companies selling tractors and farm equipment, to railroads shipping grain from the farms to the cities and ports, to investors trading futures in wheat. When the farms started to fail, it caused a ripple effect through many other sectors through the Summer of 1929, which made investors already very nervous by the time of the October stock market crash.

Trading On Margin

stock market crash newspaper

The 1920’s, leading up to the stock crash, also featured a huge amount of margin trading – when investors borrow money using stock as collateral, and use the loan to buy even more stock. Since stock prices were rising constantly, banks were happy to give the loans and investors, both new and old, were taking them and turning huge profits. So long as the profit made on the stock is greater than the interest paid on the loan, it seemed like a good idea to keep borrowing money.

However, if the stock prices start to fall when you are trading on margin, you end up both losing your investment and having to pay back the loan – with interest. Once stocks started to lose value at the start of the crash, many lenders started to fear that borrowers would lose too much value and not pay back their loans, so they “called” the loans. This meant they made investors pay back the loan amount immediately. This meant that many investors who had traded on margin were forced to sell off their stocks to pay back their loans – when millions of people were trying to sell stocks at the same time with very few buyers, it caused the prices to fall even more, leading to a bigger stock market crash.

For investors, if their stocks fell more than 50%, they would have to pay back more than the total amount they had invested. This happened frequently, causing many individuals, and lenders they were supposed to pay back, to lose their entire investments plus extra. Since they owed money with the stocks as collateral, they could not even hold the stocks and hope the value would recover – the lenders became the owners of the stock when the borrower could not pay back, and the lenders again tried to sell the stocks immediately to make up some of their losses.

Speculation

The biggest cause of the stock market crash was speculation. As prices began to rise for stocks, more investors wanted to buy to make sure they did not “miss out” on great investments. Both new and old investors saw 20%+ returns on their investments through the 1920’s, which is what drew so many new investors to put all their savings into stocks. At the same time, more and more people were trading on margin to take advantage of the rising prices and get even more profits.

This meant that as the stock prices started rising, more people were demanding more stock, which caused the price to rise even more. This is called a “speculative bubble”, and as more people were trading with more borrowed money, it began to become very unstable.

In 1929, industrial production started to slow down, with slightly less steel, cars, and houses built than the years before. This, along with the shock caused by the fall in wheat prices, finally caused some stocks to start to lose value. As soon as some investors started to lose value, many others tried to sell their stocks as quickly as possible to avoid more losses, which multiplied the problem.

Information

One of the biggest reasons the problems were able to get as bad as they did, and the panic was able to spread so quickly, was a lack of information. New investors were not fully aware of the risks they were making when they began investing (nobody let them practice on trading platforms!), and the economy was evolving so quickly that even professional investors did not know if prices were rising because of a general increase in value, or as part of a bubble.

During the crash itself, so many people were trading in such high volumes that the stock tickers were not able to keep up – often falling 3 or more hours behind the real-time prices. Since investors did not know how much they were losing, but they knew things were bad, it caused even more panic and pushes to sell everything as fast as possible. One minor result of the stock crash was a huge improvement to the ticker system to speed up how fast information could be conveyed to investors.

Pop Quiz

[qsm quiz=65]

How Is Money Created?

In the United States (and many other countries), the question “How is money created?” comes up a lot. The treasury isn’t just printing cash all day, if they were the government debt would be zero! In the US, money is created as a form of debt. Banks create loans for people and businesses, which in turn deposit that money in their bank accounts. Banks can then use those deposits to loan money to other people – the total amount of money in circulation is one measure of the Money Supply.

Money As Debt

When a person or business puts money into their bank account, it is called a “deposit”. This can be both money you are saving for the long term, or just a normal checking account used for everyday purchases. Savings accounts are generally paid interest.

When a person or business wants to take a loan from the bank to buy something, the bank uses the deposits from all of its clients in order to make that loan. Long-term savers are paid interest in exchange for letting the bank use their deposits to make these loans, but money in checking accounts can also be used (which is why some accounts charge no fees if you have a certain minimum balance).

Once the loan is taken out, the person can either take the money as cash, or (much more typically) deposit it back in to their savings or checking account. This means the money can be used to make another loan, so banks can re-lend the money again and again.

This means that virtually every dollar a bank lends out was, at some point in the chain, borrowed by someone else. The total amount of money in the economy is directly dependent on how many people and businesses have taken out loans. Even deposits made by people as income were almost certainly borrowed at some point. For example, consider this chain:

  1. May 5: Local Banks and Loans issues a loan to Frank for $10,000 to start a restaurant
  2. April 30: Bob deposits his paycheck for $5,000 at his bank (Local Banks and Loans)
  3. April 29: Alice Corporation (a software firm) gives Bob a paycheck for $5,000
  4. April 10: Carlos’s Construction pays Alice Corporation $15,000 for software it developed to plan construction projects
  5. April 1: Peggy writes a check to Carlos’s Construction to buy a new house for $200,000
  6. March 15: Peggy takes a loan out from Local Banks and Loans for $200,000

In this example, Local Banks and Loans has technically used the same $200,000 in its loans to Peggy and Frank, which was also used by a construction company to buy software, and a software company to pay its employees. The same $5,000 was used to buy a house, pay for software, hire an employee, and start a restaurant!

Reserve Requirements

To prevent banks from loaning out the same dollar infinitely, there are rules called “Reserve Requirements”. For every $100 loaned out, the bank must keep $10 on “Reserve”, meaning not re-use it on other loans. This reserve requirement can be held in the bank vaults as cash, or on deposit with the Federal Reserve Bank.

So if there is a reserve requirement, how is money created in the first place?

Relationship With The Government

When the government needs to spend money, it gets its revenue through taxes and by selling Treasury Bonds, which is effectively borrowing money from investors and banks, as well as the Federal Reserve Bank. The revenue it receives from sales of bonds to the Federal Reserve Bank is then injected in to all the other banks as the government spends money, which is what creates the initial cash “seed” that all other lending is based on – the economy buys debt from the federal government, which uses the cash to feed back in to the economy.

Currency Backing

Historically, currency has been “backed”, or readily converted in to, some material good.

Even though money is created by debt, we can say that it is “backed” by the value of all the goods and services that we use that debt to produce. Without Peggy’s loan (and other loans like it), Carlos could not buy the software, and Alice would not have been able to hire Bob to write it.

The Gold Standard

Ancient History

In ancient history, the question “how is money created” was easy to answer – they dug it up!

The primary form of currency for thousands of years was gold and silver – these metals were mined, then minted into coins. If a government wanted to “print” more money, they would melt down existing coins, then mix the gold and silver with cheaper metals (like iron and copper), then mint new coins (and hope people didn’t notice the difference).

Paper money came into existence first by banks similar to what today we would call “certificates of deposit”, or CDs. As proof that you deposited some amount of money at a bank, the bank would give you a piece of paper engraved with the bank’s information and the amount you deposited. You could then come back at a later date and request that amount in coin, or give another person authorization to withdraw some of your deposit for you (similar to a “check” today).

As more and more customers came to each bank, they standardized the certificates in set amounts, and issued people what looked like today’s money. However, since each bank was issuing their own notes, you would need to go to each bank individually to request the coins, then take them back to your own bank.

The United States

Before we started using debt as money, all money in the United States was “backed” by gold and silver – each dollar represented a specific amount of gold, and banks needed to move gold reserves between them each time someone wrote a check. This process was very expensive and time-consuming, and also meant that the total amount of money in circulation was directly proportional to how much gold was mined.

There were also reserve requirements under the Gold Standard, the reserve was simply an amount of physical gold that a bank needed to be holding at all times. This meant that when people and companies wrote each other checks, banks had to physically ship gold out to other banks every day (this was often done by rail, which is why rail robberies used to be common).

This meant that if there was an economic expansion, but gold could not be mined quickly enough, there could sometimes be not enough money to go around, causing the expansion to slow. This also meant that the government is not able to start spending money during recessions as “relief”. The Gold Standard was ended in the United States in 1976.

Pop Quiz

[qsm quiz=49]

Definition

Cottage Industry, or the “Putting Out System” is a production system of producing goods that relies on producing goods, or parts of goods, by craftsmen at home, or small workshops, instead of large factories.

History

The contractors would then create the goods at home, or their “cottage”, and deliver them upon completion. The major advantage of this system is that it allowed farm workers to continue producing food and other agricultural goods, while filling their orders of finished goods during the time between planting and harvest. “Cottage Industry” describes the methodology that was used to produce most goods throughout human history, up until the end of the Industrial Revolution. Under this system, if a person or government wanted to make a large number of a particular item (for example, a government ordering 1000 military uniforms), instead of building a large factory and hire a large workforce, they would hire as many contractors to produce a small number of the items each (in this example, the government would ask 100 sewers to make 10 uniforms each).

Another major advantage was that until very recently, most of the world’s population did not live in or near towns and cities, but rather in small farming villages. This system allowed the creation of goods across a very large area without requiring the population to travel to central factories every day.

Cottage Industry and the Industrial Revolution

After the Industrial Revolution, many goods that were formally produced using cottage industry were moved to factories, which benefited from a division of labor and a steady workforce.

However, since most products are produced in stages, each stage moved between “cottage production” and “industrial production” in stages as well. In the examples of producing a shirt, first the cloth needs to be made from cotton, linen, or wool, then the cloth needs to be cut and sewn into a shirt. If the shirt has buttons, those buttons need to be produced out of metal, then sewn on to the shirt.

In a classic cottage industry, a farm would sell the cotton, linen, or wool to many “cottages”, who would then spin it in to yarn, use a loom to create fabric out of the yarn, then cut and sew the fabric into a shirt. If they needed buttons, they could buy them from another “cottage” that produced buttons, then sew them on to the shirt.

When the industrial revolution started, it began with the production of textiles and fabrics. This means a large factory would buy the cotton, linen, and wool from farmers to turn into fabric, then sell the textiles to “cottage producers”, who would complete the remaining steps.

Next, new industrial processes allowed the creation of metal goods in factories instead of a blacksmith’s shop. This means that one factory would produce the fabric and another would create the buttons, and both send it to “cottage producers” to complete.

When the sewing machine was developed, the entire process was fully industrialized – one factory would create the fabric, another would create the buttons, then both would send their products to a third factory which cut and finished the shirts. The centralization of production allowed much more products to be produced much faster, and since the “middle products” (fabric and buttons in this example) did not need to be shipped in small quantities to dozens of locations, cost also dropped significantly.

Cottage Industry Today

Even though most goods are now mass-produced, goods made by hand (or done using “cottage production”) can still be seen as a sign of higher quality. For example, expensive business suits are still generally made by hand by experienced tailors, and expensive shoes are often made by hand by expensive cobblers.

In the last few years, many “cottage producers” have begun selling their goods on the internet (like Etsy.com, which can be traded on this simulator with the symbol ETSY, which is entirely dedicated to cottage production), which has led to a resurgence of cottage industry for custom and hand-crafted goods. However, transitioning away from cottage production to industrial production for most goods is still seen as a very important step for developing countries.

Pop Quiz

[qsm quiz=48]

If you’ve started buying a few stocks, you will probably be interested in diversifying your portfolio between various sectors.

This sounds easy, but it can be very challenging finding stocks from a wide range of sources that fit what you’re looking for. Thankfully, our Quotes Tool has all the information you need to get started.

First, head to the Quotes page and click “Markets” at the top:


Once you’re here, click “Sectors” on the lower menu:

This page will have a list of sectors you can choose from, both general categories (like “Real Estate” and “Energy”), along with sub-sectors (like “software” or “communications equipment” in the Technology sector):


You can filter between major US or Canadian sectors by default, but once you view any specific sector, you can also see stocks from other countries (like the UK).

Once you click on a sector, a graph will automatically appear showing the performance of the top 3 companies in this sector (by market capitalization), but you can have up to 8 different companies charted against each other at a time.

The “industry peers” are listed below the chart. By default, the top 50 will appear, but you can load as many as you like. Clicking the symbol on the list will give a detailed quote for that symbol, and international companies are included.

This can be a great tool to find stocks you might not have thought of, or just a great way to quickly compare industry leaders when you’re looking to diversify your portfolio.

Pop Quiz

[qsm quiz=59]

Definition

“OHLC” stands for “Open, High, Low, Close”, and this is a chart designed to help illustrate the movement of a stock’s price over time (typically a trading day, hour, or minute)

bar chart definition

Example of a bar chart for Google

Details

OHLC charts are also known as “Bar Charts” because they display the information as a series of line segments instead of as a continuous line. Bar charts are very useful to see how prices are moving in a period of time – the longer the line segment, the more the price has moved during that time.

The example above is a bar chart for Google, with the bars representing 5 minute intervals. The top of each line is the “high” price reached in that period of time, while the bottom of each line is the “Low” point. The longer the lines, the more volatile the stock.

You can find these charts on our Quotes page for every US stock, and most international stocks.

Your transaction history page will show you all the orders you’ve placed that have gone through.

transaction history

Features

Everything on this page is used to help you see your previous transactions.

Action Button

This will take you back to the trading page, set to repeat this action. This button will not fully pre-populate an Options order (particularly expired options), or Future Options.

Symbol

This is the symbol of what you traded, clicking it will bring up this symbol on the Quotes Page. Hovering over will give the full company name and the currency you purchased it in.

Changing Dates

You can use the date selector above the table to change the date range shown. This also applies to the Excel export. On some tournaments the content on the page may not update, but you can still get previous information through exporting.

Exporting to Excel

There is a small Excel icon in the top right that will export the transaction history of your specified date range as an excel spreadsheet.

Other Tools

You can also see your quantity, price paid, and date of each transaction. If you hover over the “Price”, you’ll also see the commission charge and exchange rates. If you hover over the date, you can also see the order type (buy, sell, short, or cover).

Uses

Your transaction history, along with your open positions, is the most accurate way to see how your portfolio value is calculated. By comparing the purchase and sale prices, you can calculate the profit (or loss) you’ve made on each trade.

Calculating your profit and loss using the transaction history is the only way to get an accurate view of your profit and loss, and these are the actual values used when determining  your portfolio value. By contrast, your Closed Positions page is only an estimate, and can be inaccurate (especially if you buy and sell a security multiple times without “fully closing” your position each time)

Your closed positions page will show an estimated profit and loss from all positions you’ve “Closed” (bought then later sold, or shorted and later covered).

Closed Positions

Disclaimer

The most important note about your Closed Positions is that it is only an estimate, and nothing on this page is used to calculate your portfolio value. Inaccuracies are usually caused by buying and selling the same security multiple times without fully “closing” the position each time, but it can be caused by other factors as well. Your commission charges are also not factored into this calculation.

For a fully accurate view of where you’ve made and lost money on trades, calculate it manually using your Transaction History page.

Features

This page has more information about each set of trades than any other, so you will need to horizontally scroll to view everything. This is a brief description of some of the information you’ll find:

  • Date is the date you closed the position
  • Order Type specifies the kind of order you placed. The top is the order which “opened” the position, the bottom is the order that “closed” it
  • The multiplier is used in Options and Futures orders to specify the contract size
  • FX rate is your currency exchange rate, this will always be 1 if this security is denominated in the same currency as your portfolio
  • The “Purchase Price” uses a weighted average if you purchased the security at different times at different prices
  • The “P/L” is also based on these weighted averages. It will be very accurate if you buy your shares all at once and sell them all at once, but becomes less accurate if you buy and sell at multiple times
FAQ

Open Positions

You can find your Open Positions page in two places: your Dashboard, or your Open Positions page.

open positions

The only difference between the two pages is that the “Dashboard” version will have all the security types as tabs you can switch between, while the “Open Positions” page will show each type separately.

All prices on the Open Positions page are delayed by 15 minutes (but trade at real-time prices).

Views

You can view your portfolio either as a list of your securities (10 will show per page, if you have more you can switch pages), or as a series of charts

List View

open positions

The list view is the default. The special feature of this view is that the prices for US equities will update every few seconds, so you can see how your portfolio is evolving.

Chart View

chart

You can switch between daily, monthly, or yearly performance charts for your holdings. Note that not every security type supports charts, and not every security will have a chart available.

The charts will show the performance of that security, color coded. Green means you’re making money, red means you’re losing money.

Features

Besides updating prices and charts, there are some other handy features available on the Open Positions page:

  • Export to Excel – you can export your open positions by clicking the small excel icon in the top right

excel

  • Get a detailed quote – if you click the symbol on the “List” page, you will get a detailed quote, along with current charts and news, for that stock
  • Charts and news – There are also small buttons that will take you direct to the chart or news page for that symbol
  • More data than meets the eye – if you hover over some of the numbers, we’ll give you even more information:
    • Hover over the symbol to see the full company name, and the currency this stock is denominated in
    • Hover over the “Last Price” to see how much the price has changed today
    • Hover over Market Value to see how much it is worth in your local currency (useful if you buy international stocks)
    • Hover over your % return to get the total amount of money you’ve made or lost on this position
  • The trade button will take you to the trading page for this security, pre-populated to “close out” your position (so if you own 10 shares of Sprint stock, this button will take you to the trading page, set to Sell 10 shares of Sprint stock)

Stock-Trak Project

Requires weekly trades, explanations, and a final report (22% of total grade).

Two portfolios are tracked for each student. One portfolio is passively managed after the first week, and the second portfolio is actively managed given weekly requirements. The portfolio has a total return objective.

Week 1 (trades from Feb 8 through Feb 12)

Students purchase (broad index) ETFs to construct a portfolio that is consistent with the following asset allocation guideline (at market value).   For the fixed income portion of the portfolio, students use a combination of Treasury Bonds and fixed income ETFs (or ETNs).   Limit the amount invested in only one ETF or ETN to $100,000. Commodities can be purchased in the cash market (corn, wheat, gold, silver, and major currencies) or using an ETF; however, the real estate exposure must be obtained using an ETF on a broad real estate index. The passive and active portfolios should be established with approximately the same holdings and weights (i.e., same trades and same returns during the first week). I suggest placing these initial orders when the market is open (i.e., after 3 pm). The passive portfolio should not need to be adjusted during the remainder of the term.

Asset Class Target Minimum Maximum
U.S. Large Cap. Stocks 40% 30% 75%
U.S. Small Cap. Stocks 10% 0% 25%
Non-U.S. Stocks 20% 0% 25%
Fixed Income 20% 15% 60%
Real Estate 3% 0% 10%
Commodities including currencies 3% 0% 10%
Cash and equivalents 4% 0% 15%

Week 2 (trades from Feb 15 through Feb 19)

Stops, shorting and buying on margin

  1. For the active portfolio, establish at least three stop loss orders for the ETFs in the existing portfolio (e.g., set the stop price at about 10% or more below the current price).
  2. Students establish a margin account by borrowing funds (i.e., in Stock-Trak, the margin loan occurs automatically when more securities are purchased than the cash that is available and/or by short selling). That is,

(a) buy additional shares of at least three ETFs in the existing portfolio (purchased in the first week) and

(b) short sell a health care sector ETF. The sector ETF will reduce your exposure to health care.

  1. Target the active portfolio value to be at least $1,400,000.

Week 3 (trades from Feb 22 through Feb 26)

Rebalancing and buying mutual funds, levered ETF and an ultra-short ETF

  1. Replace (i.e., sell) 20% of the large cap ETFs by purchasing an index mutual fund, and sell 20% of the small cap ETF by buying an actively managed small cap mutual fund(s).
  2. Increase the systematic risk of U.S. securities by selling regular broad index ETF and purchasing levered ETF like those from ProShares (e.g., Ultra S&P 500 with ticker of SSO).
  3. Reduce exposure to international equities by purchasing an Ultra-Short ETF like those from ProShares (e.g., Ultrashort MSCI Japan with ticker of EWV).

Week 4 (trades from March 1 through March 5)

Based on expectations of commodity prices, currencies, and interest rates, establish futures positions in commodity, currency, and bond (avoid purchasing a contract that is expiring in the current month).

  1. Use futures contracts to increase (or decrease) the percent of commodities and non-U.S. currencies in the active portfolio by at least 3% of the total value of the portfolio (e.g., if the current portfolio value is $1,500,000, then increase holding of a commodity by an additional $45,000 based on the notional, or contract, value of the futures contract).
  2. Increase (or decrease) the interest rate risk of the active portfolio by using a bond index futures by at least $100,000 in notional value. That is, buy T-bond futures to increase interest rate risk and sell to reduce interest rate risk.

Week 5 (trades from March 8 through March 12)

Futures transactions in equity market and adjustments for sector weightings (avoid purchasing a contract that is expiring in the current month)

  1. Based on expectations for the equity market, increase (or decrease) the systematic risk of the portfolio by using index futures (by buying or selling equity index futures). If the portfolio does not have sufficient cash for the margin required by the futures contract, then shares of ETFs will need to be sold.
  1. Adjusting sector weighting, leveraging and buying short positions. Establish sector over-weighting and under-weightings using ETFs or mutual funds in the portfolio for at least two additional sectors. Students can reverse the health care position from prior transaction.

Week 6 (trades from March 15 through March 19)

Option returns versus stock returns

(Avoid purchasing a contract that is expiring in March)

  1. Purchase three individual stocks by selling the appropriate ETF(s).
  2. For each stock, purchase an out-of-the-money call.
  3. For each stock, purchase an in-the-money call.

This is not an option strategy; however, I will want comments in the final report on the impact of buying an option compared to buying the individual stock (keep track of the returns on the stock (include dividends) and call options). See D2L announcement note for option symbol used in Stock-Trak.

Week 7 Spring Break

No required trades (from March 22 through March 26), but can trade to rebalance

Week 8 (trades from March 29 through April 2)

Basic Option Strategies  

(see D2L home for an announcement related to option symbols)

  1. Purchase two additional individual stocks (at least 100 shares) by selling the appropriate ETF(s). For each stock, purchase a put option to establish a protective put position.
  2. Purchase two additional individual stocks (at least 100 shares) by selling the appropriate ETF(s). For each stock, write a call option to establish a covered call position.
  3. Purchase a put option for one of the ETFs to establish a protective put position.
  4. Sell a call option for one of the ETFs to establish a covered call position.

Week 9 (trades from April 5 through April 9)

Advanced Option Strategies

  1. Establish a long straddle and a short straddle for two different stocks that are not currently in the portfolio. A long straddle requires the simultaneous purchase of a call and put for the same strike price, and a short straddle requires simultaneous writing of a call and put for the same strike price.
  2. For an individual stock not currently owned, create a Bull (or Bear) Money Spread (go to trade options − spreads and buy a call and write a call, where the call purchased has a lower strike price than the call that is sold).
  3. Purchase 3 individual stocks (that are new to the portfolio).  For each of the 3 stocks, create a collarA collar is basically a protective put plus a short call option.  Alternatively, a collar can be thought of as a covered call with downside protection. For each of the new stocks, buy an out-of-the-money put and an out-of-the money call for the same expiration month.  For example, immediately after purchasing a stock for $100, go to trade option and then to combo and buy a put option with a strike price of $95, and write a call option for $105.

Week 10 (trades from April 12 through April 16)

Trade at least ten individual stocks, of which at least two are from a foreign exchange and two additional securities are ADRS trading on a U.S. exchange; otherwise, there are no restrictions beyond Stock-Trak’s margin loans (trade as much as desired, but save enough transactions to close derivative positions and short positions in Week 12).

Week 11 (trades from April 19 through April 23)

After the in-class presentations, students are required to:

  • Buy 3 and short sell 2 of the stocks that were presented on Tuesday, and
  • Buy 3 and short sel1 2 of the stocks that were presented on Thursday.

Begin to close derivative positions (especially those with low volume).

Week 12 (trades from April 26 through April 30)

Rebalance the portfolio to be within the asset allocation guidelines after closing all derivative positions and short positions (volume may be an issue for closing some of these positions—try several times during the week for low volume issues).

Every Week

On Tuesday of each week, each student is required to turn in a summary and explanation of the trading activity in the active portfolio for the prior week (1 or 2 brief paragraphs). The top 5 portfolios based on total portfolio value will receive 5 bonus points, and the bottom five will lose 5 points (this is to prevent excessive risk taking).

The Weekly Stock-Trak summaries are turned into the dropbox in D2L as a word file and must contain the student’s name and indicate the report week (minus 5 points name or report week, if missing). Each student summary requires (no image files or print screens):

  • an explanation of trades made,
  • a comparison of the returns of the active portfolio to the passive portfolio,
  • completion of the statement: “This week, the most important insight gained (or technique learned) was . . . .” , and
  • proper citation of sources used in gathering the information used in the trade decisions.

Stock-Trak Presentation

A two to three minute PowerPoint presentation is required (assigned for either day 25 or 26, which is either May 4 or May 6). The presentation is due to a D2L dropbox on the presentation day and will summarize each student’s trading over the 12 weeks with slides that describe (or outline) the following:

  • Worst trade
  • Best trade
  • Most important insight gained from Stock-Trak

Final Stock-Trak Report

The final Stock-Trak report will include a discussion and analysis of the fund’s performance by comparing the active portfolio to the passive portfolio (and/or a major index). A summary of the individual stock trades and their performance is required. Students with portfolios with open positions in a derivative security will not be eligible for the bonus points.

Students with portfolios with open positions in a derivative security will not be eligible for the bonus points, and will have 5 points deducted from their score.

Final Stock-Trak Report: The report is required to be in a research paper format, which is organized using the following Template/outline and includes a discussion and analysis of each of the following:

  1. A comparison of daily returns of the active portfolio to the passive portfolio over the trading period (downloads daily portfolio values from Stock-Trak to an Excel spreadsheet, remove weekends, calculated daily returns).
    • Calculate and compare arithmetic and geometric means (daily and annualized).
    • Calculate and compare volatility measures; i.e., standard deviation (daily and annualized), range, coefficient of variation.
    • Compare other characteristics of the return series (i.e., skewness and kurtosis).
    • Calculate and discuss the correlation between the active and passive portfolio (does the correlation seem reasonable, given the trading in active portfolio?).
    • Regression of Active (y-axis variable) vs. Passive portfolio (x-axis variable) returns.
      • Intercept: What is the intercept’s value and is the intercept significant at the 5% level? Note: that the intercept is similar to the Jensen’s alpha.
      • What is the value of the beta coefficient and its interpretation?
    • Calculate and compare the HPR over the trading period for the active and passive portfolios to the S&P 500. Does the relationship seem reasonable given the risk associated with each portfolio/index?
    • Are markets efficient, nearly efficient or inefficient? (justify the response based on your trading)
  2. A comparison of the holding period return of the three stocks that were purchased relative to the three out-of-the money call options and the three in-the-money options on the same stocks.
    • Total investments in each stock, out-of-the money call, in-the-money call (include margin)
    • Total return on stock (include dividend if one was paid) and each call option
    • Compare the HPR on each stock and the corresponding options
    • Conclusions from options trades
  3. Examples of impact of risk and return from the following trades:
    • Protective puts
    • Covered calls
    • Other option strategies
    • Use of futures contracts
  4. What were the most important insights gained from the Stock-Trak simulation?
    1. From your trading strategies (required and/or otherwise)
    2. Market trends and conditions during the 12 weeks
    3. Overall
  5. Given the rules and quirks of Stock-Trak, how can the classroom experience be enhanced?

Appendices should include:

  • Data used in Excel spreadsheet (include arithmetic and geometric returns, daily means and annualized means and standard deviations)
  • Chart of daily portfolio values of active versus passive portfolios
  • Chart of daily returns of active versus passive portfolios
  • Descriptive statistics of the daily returns
  • Regression output of daily returns of active versus passive portfolios

Click Here for the full course outline and how this project fits in

Definition

Spot and Futures contracts are a standardized, transferable legal agreement to make or take delivery of a specified amount of a certain commodity, currency, or an asset at the current date. The price is determined when the agreement is made.

The only difference between spots and futures is the delivery date. The current date is used for spots and a later date is used for futures.

Just like futures, spots frequently settle in cash instead of actual physical delivery of the asset traded but with some small differences.

Why use Spots?

Spots were originally created to buy and sell commodities such as wheat, currencies, gold, etc and then you would own those assets.

Spots can also, just like futures, be traded without physical delivery. You can buy a contract for wheat at $1 and then sell that contract when the spot price of wheat is higher to make a profit.

Trading currency spot contracts is a form of Forex trading.

Example

Two different trades buy gold at a spot price of $1000. The first trader decides to take delivery and receives the specified amount of gold in his contract at the price of $1000 which is delivered in the next few days. The first trader then puts his physical gold in his vault and holds on to it for five years and then sells his physical gold in the market at a given price.

The second trader holds on to his contract for five years and instead sells his contract at a given price.

Both traders will make a profit or loss depending on the price on that given day. However, the second trader that simply kept his spot contract will have had lower costs since he only traded through his broker. On the other hand, the first broker had to be able to store his gold, with a safe or other, and then physically sell his gold. We can see that in the example of wheat, this would not be a good idea as the wheat would probably have spoiled after five years.

This illustrates a key point in spot trading. It is possible to trade spot contracts for various prices but they can also be used for immediate delivery of the underlying asset. The easiest to understand is currency trade as that can be done through the banking system with “electronic” delivery of the currency bought.

Simulator Spot Trading

Spots are very easy to trade (if your contest allows it). Simply choose the action like you would with a stock, select the quantity and the spot you wish to trade from the dropdown from the Spots trading page.

spots

Trading Details

There are a few things to note with spot contracts:

Types

There are 3 major types of spots, all of which will be in the same drop-down menu:

  1. Currencies, like Euros or Australian Dollars (purchased at the current exchange rate, like Forex)
  2. “Durable” commodities (like gold, silver, and oil)
  3. “Soft” commodities (like wheat, corn, and soybeans)

Not everything you can trade as a future will be available as a spot (for example, we have Cocoa futures, but not Cocoa spots). In real life, taking delivery of soft spots can be risky, since they can spoil, but you can’t take delivery here so that won’t be a problem.

Order Types

We only support market orders for Spot contracts

Quote Details

Unlike a stock, the quote for a Spot is very different. We will only show the last price, bid, and ask. We do not show the day’s trading range, and we set functionally infinite volume (you can buy as much of a spot as you can afford)

Pop Quiz

[qsm quiz=60]

Definition

Futures Contracts are a standardized, transferable legal agreement to make or take delivery of a specified amount of a certain commodity, currency, or an asset at the end of specified time frame. The price is determined when the agreement is made.

Here are some useful terms for futures:

Contract Size: This specifies the number of units of the underlying future to be delivered. It could be in barrels, tons, liters, etc. We use this contract size to determine the multipliers on our website. The multipliers essentially multiply your profit/loss for every contract. For example, if the delivery is 10,000 liters of orange juice one contract of OJ would multiply your profit loss by 10,000. Hence if the price of your future contract moves from 1$ to 1.01$ you will gain 100$ (10,000 * 0.01$) for each contract you own. These vary widely from future to future from contract sizes of 10 to 100,000.

Margin: Futures do not ask you to put the entirety of the deliverable cost upfront. It is determined by margins and vary widely from future to future. On this simulator that is the actual “cost” of the money you have to put aside. In real life you would get margin calls and have a maintenance margin depending on how much money you have lost or gained depending on the current market price of the future which will limit your losses. On our platform, however, there is no maintenance margin or margin calls so it is possible to lose very large sums of money.

Termination Of Trading: This determines when the most current contract will stop trading. It can vary quite a bit from future type to future type. Certain futures stop trading months before the actual delivery so be sure to check on CMEGroup if you are unsure.

Trading Hours: The trading hours for futures vary depending on the type of future. Currency trades close to 24 hours a day whereas other futures have large trading halts during the day monday to friday.

Note:Many sites do not make the discrepancy between electronic trading and trading on the floor. It is important to check that your future is trading electronically as on the floor trading is typically not available to the average investor and is not available on this simulator. Again, you can check on CMEGroup for the exact trading times of each future.

Example

If I buy a December Crude Oil contract I am saying that I will deliver x amount of barrels (as stated in the contract) by the settle date in December and the counter party of the futures contract will give the dollar amount specified when buying the contract. However, in real life as on the simulator, physical delivery of these contracts are actually quite rare (you will never deliver any physical goods on the simulator). What is more common is to simply settle the difference as a profit or loss in the owners investor account. Hence if we buy a Crude oil future for 50$ and the price changes to 55$ at delivery it will be 5$ per contract times the contract size.

Why use Futures?

The original use for futures was to hedge against uncertainty. A farmer or the company that buys his crops could use futures to “lock-in” a price ahead of time and therefore make budgeting and other monetary decisions far easier. The same can be said for airlines who do not want to have to deal with daily price fluctuations and so use futures to know the price ahead of time.

Futures are still used in this matter but have also evolved to broader markets, most notably trades and speculators.

Futures also provide a way to greatly leverage positions due to the low margin costs and large contract sizes (multipliers)

Simulator Future Trading

Before you trade futures, you should know that they trade differently from other security types.

When you buy a futures contract, you aren’t actually paying for its full value – you are just agreeing to pay for the goods that it represents at a later date. This means your “Cash Balance” will not go down. However, you do need to put down a deposit, so the “Margin Requirement” is deducted from your buying power.

The margin requirement can vary by future, but it will appear when you get a quote for the contract you are interested in. Futures also trade in contract sizes – one futures contract can represent 100 or even 1000 of the commodity it represents (this will also appear in the quote as “Contract Size”).

When you want to sell your future, this is when cash changes hands – you will make (or lose) cash based on how much the value of the entire future changes during the period you were holding it. This makes trading futures very risky – if you have a future with a contract size of 10,000, and own just 10 contracts, that contract can go down by just $3, and you will have lost $300,000.

If your contest allows trading futures, you can find them on the Futures trading page.

  1. Action: Here you can select: Buy, sell, short, cover just as you would for stocks.
  2. Quantity: Enter the quantity desired of options contracts. Remember even with 1 futures contract you can have huge exposure depending on the contract size. Always look at the volatility and contract size of the future you are trading to determine your level of risk.
  3. Contract:This will list the category of contract you wish, indices,food,energy, etc. You can then select the specific futures contract you want in the “select symbol” drop-down.
  4. Month-Year: This can only be selected after selecting the future you want. This will select the contract month of your option. Note: if you get an error it is usually because the month and year you selected has expired, simply look at the next month or year to get a current future expiry.
  5. Order type: Here you can select whether you want a market, limit or stop order.

Select preview and you can confirm your purchase.

futuretrade

Note: futures trading can be risky due to the high leverage used. They also have a lot of small nuances and complexity. It is always a good idea to get as much information as possible straight from the source from CME Group or in certain cases Ice Futures

Pop Quiz

[qsm quiz=62]

We have a huge amount of research tools available on our Quotes Page. On this page, you’ll find a second level of navigation to move between different research tools right at the top.

quotes nav

Basic Quotes And Beginner’s Research

If you’re just getting started, most of the information you’ll need will be in the main “detailed quotes” page.

Detailed Quotes

quotes page

At the top you can enter your symbol, and click “Go” to pull up the detailed quote. On this page you will find:

  • A chart showing this stock’s performance so far today. If it is the morning before markets open, the chart will be blank. If it is a day where the markets are closed, the chart will show the last trading day. There are also tabs to see different date ranges, but you can get more detailed charts on a different page.
  • You can also find the “Last Price”, “Bid“, “Ask“, day’s change (both in dollar amounts and as a percentage), the trading day’s high and lows, and the previous trading day’s closing price
  • You can also find the “Last Trade” timestamp. This is important for thinly-traded securities – a security needs to trade in the real world for it to trade in our system. If this timestamp doesn’t have today’s date, it means that this security hasn’t traded today, so your order will not immediately execute if you try to trade it
  • The volume indicator is also important for trading – you can only trade as much of a security as has traded in the real world on a given day (could be more or less depending on your tournament rules, but there will always be volume restrictions)
  • If this stock has an upcoming dividend, you can also see the date, rate, and amount
  • You can also get some other basic information about the stock itself, such as the total number of outstanding shares, the Earnings Per Share, and the PE ratio (along with a notification of which exchange provided this quote)

News

You can also get news on each stock from this page, just below the Detailed Quote there will be a news feed with the most recent stories featuring this stock.

You can find the News as part of the detailed quotes page, or on its own by selecting “News” from the drop-down menu next to the symbol input, or as a tab on the research navigation

news nav

Charts

quotes charts

You can also see a variety of chart types. You can switch between different chart types, but below will always be a chart showing volume.

bar chart

You can switch between the following chart types:

  • Line
  • OHLC
  • Candle
  • Area

There is also a switcher at the bottom that will let you toggle between time horizons, anything from intraday through 10 years. There are more tools in the Charts tool that we will cover in “Advanced Research”.

Company Information

You can find information on most companies as well, including a brief description of the company, their corporate address, CEO, and their classification used in the Pie Charts on the “Company” page

company

There are also some tools for fundamental analysis on this page, which we will cover in the “Advanced Research” section.

Historical Prices

You can also get the historical prices for stocks on the last tab in the main navigation:

hsitorical

This will show the date, open, high, low, close, volume, change, change percentage, and adjusted close (adjusted for dividends and splits) of nearly every stock. We do not currently have the ability to export this information to Excel directly, but you can specify your date range and copy/paste to excel yourself.

Overall Market Information

On the main quotes navigation, the first tab is “Markets”. This will show overall market information which is not relevant on any particular symbol.

markets

Overall Market Data

The “home page” for this will show hourly charts for the NASDAQ, S&P500, and a composite of the S&P500 and TSX indices.

Market News

You can also get a snapshot of overall market and specific sector news


marketnews

By clicking either of these items, you can filter down to a specific sector, or a specific “topic” (OTCBB stocks, or mutual funds, for example).

Below this news feed, you can also see the volume of some of the biggest stocks on a few exchanges, along with the current Forex rates (denominated in US Dollars).

Indices

The “Indices” link will show you a snapshot of selected indices from the United States and Canada

indices

Movers

The “Movers” tab will show the day’s biggest market movers, selected from stocks on the NYSE

World

The “World” selection is somewhat more limited, but does feature composites of several world markets, along with some daily performance charts

Sectors

The “Sectors” tab will show a list of all major sectors, along with many sub-sectors. By clicking on any, you can get a 5-day comparative chart showing the top several stock’s performance, along with some basic quote information of the biggest players in each sector.

ETFs

The ETFs selection will show the top 10 best and worst ETF performers from the last trading day (you can switch between US and Canadian ETFs).

The bottom features an ETF snapshot, where you can switch between any ETF family you are most interested in.

IPOs

The IPOs research section features a news section for new IPOs, along with news feeds for the US and Canada, which outlines both new listings, de-listings, re-listings, and suspensions. There is also a pie chart to illustrate the balance between the four categories.

Forex

The Forex tab will show the current exchange rates for any currency pair (over 50 currencies represented). There is a currency converter tool along with the current exchange rates in USD for all comparisions, along with a cross currency table for 8 major currencies.

Rates

The “Rates” tab outlines the major US interest rates, long with major US bond rates. You can also find GDP growth, mortgage interest rate data, and unemployment data on this page.

Analyst Ratings

You can also find expert analyst ratings for nearly every stock, including the rating of buy/sell, how many analysts are recommending each, and a brief illustration as to why the analysts are suggesting what they do under the “Analysts” tab.

Advanced Research

There are also numerous tools for more “in-depth” research”

Options

The “Options” tool on the main menu will show the option chain for most stocks.

Option Chains

By default, it will show a composite filter of calls and puts that are expiring soon and are “Near the money”, but you can also change these filters as you see fit.

Most Actives

You can also see which options for a particular stock are seeing the most volume for a day, both by LEAPS, Calls, and Puts.

Greeks

For more technical traders. you can also see the delta, gamma, rho, theta, vega, and IV for most options.

Advanced Charts

At the bottom of the Charts page, there are more buttons to see more advanced charts:

charts

The advanced chart page supports many technical indicators, including adjustment for splits and dividends, just splits, or completely unadjusted. You can also plot each symbol against an index, or up to 10 other symbols.

You can also add more indicators, such as several different types of moving averages, Bollinger Bands, and many other indicators.

Advanced Company Info

On the “Company” tab, you can also find information on shares and several key ratios

company3

Share Information

The share information page will have a lot of information on the per-share statistics of this company, including:

  • 52 week highs, lows, and change
  • 21, 50, and 200 day moving averages
  • Alpha, Beta, R-Squared, and Standard Deviation over 21 months
  • Price changes over 7, 21, 30, 90, 180, and 200 days
  • Month-, Quarter-, and Year- to date changes
  • Average volume and shares outstanding
  • Institutional holdings, along with the institutional buys and sells over the previous 3 months
  • Some insider trading statistics

Key Ratios

You can also find some quick ratio information, such as Total Debt to Equity, Leverage, Margins, Return on Equity, and P/E ratios (among others).

Financial Statements

For fundamental analysis, you can find the balance sheets, income statements, and cash flow statements (separated annually or quarterly) on the “Financials” tab

financials

SEC Filings

For US equities, you can also find all the paperwork they have filed with the SEC, exportable to HTML, Microsoft Word, PDF, or (occassionally) Excel or Microsoft Access under the “Filings” tab.


What are options?

An option gives the owner the right, but not the obligation, to buy or sell the underlying instrument(we assume stocks here) at a specified price(strike price) on or before a specified date(exercise date) in the future. (this is different for European options as they can only be exercised at the end date). Exercising the option is using that right to to buy or sell the underlying instrument.

In simpler terms, an option allows you to pay a certain amount of money (the option price) to allow you to buy or sell a stock at the price (strike price) you decided on when buying the option.

A call gives you the ability to buy at a specified price, whereas a put gives you the ability to sell at a specified price.

Example

Let’s say we wish to exercise 20 AAPL October 20th call options which have a strike price of $100. We would let our broker know and he would then “use up” your option contract (hence it no longer has any value) and buy 20 * 100 (each option contract is for 100 shares) 2000 shares of AAPL at a price of $100. This also means you have to have the money to be able to buy 2000 shares at $100 = $200,000. If AAPL is at $105 you would then earn $10,000 profit on this trade.

Brokers will often times allow you to simply take the profit as well just like you would at expiry by immediately selling the shares. Hence in the example above you would just obtain $10,000 instead of needing the $200,000 cash to have to purchase the stocks in the interim.

Why use options?

At it’s core options simply track the underlying asset’s price and so why would we buy an option instead of the underlying asset?

There are two major reasons; leverage and strategies.

1.Leverage

Option’s provide you with being able to greatly leverage your positions since each option contract is for 100 shares. This means you can greatly increase how much you make (lose) with the amount of money you have.

If we look at a very simple example we can see how we can greatly increase our profit/loss with options.

Let’s say I buy a call option for AAPL that costs $1 with a strike price of $100 (hence because it is for 100 shares it will cost $100 as well)
With the same amount of money I can buy 1 share of AAPL at $100.

Now let’s say the price of AAPL rises to $101 and we sell our positions.

With the options I can sell my options for $2 or exercise them and sell them. Either way the profit will $1 times times 100 = $100
If we just owned the stock we would sell it for $101 and make $1.

The reverse is true for the losses. Although in reality the differences are not quite as marked options provide a way to very easily leverage your positions and gain much more exposure than you would be able to just buying stocks.

Note: this is a very simplified example to explain the concepts.

2. Strategies

There is an infinite number of strategies that can be used with the aid of options that cannot be done with simply owning or shorting the stock. These strategies allow you select any number of pros and cons depending on your strategy. For example, if you think the price of the stock is not likely to move, with options you can tailor a strategy that can still give you profit if, for example the price does not move more than $1 for a month.

Option Pricing

Option pricing is typically done using the black-scholes model which can be quite complex. The main thing to understand is that american-style options have intrinsic value because of the fact that they expire in the future. The option’s price will therefore reflect the immediate profit you could make (if any) by exercising this option and the time value.

For example, an out-of-the money (you would not exercise this option because you would lose more money) put would still have a price above 0 as long as it is not expired because there is always a chance that the option may become in-the-money (by exercising this option you would gain money, note:this does not mean, however, that you are making a profit. You can be in the money but still losing money because the option price is greater than the profit you make from exercising the option).

Option Payoff diagrams

Option Payoff Charts and tables are very useful for visualizing and understanding how options work. In these scenarios you have already purchased or “written”(writing an option means you have sold the option to someone who has bought it) the option. The stock price is a “what if the stock price goes to that price”.

Example 1: Bought Call Option with a $11 Strike Price and an option price of $1.5 for 1 share in the contract (normally this is 100 shares per contract) and a current price of $10

Stock PriceStock – Strike PriceOption Profit/LossComment
0-11-1.5In this case, the option is out of the
money and you would not exercise it,
hence the most you can lose is the price you paid.
10-1-1.5
110-1.5This point is called “at the money”
11.50.5-1You are now in the money but still losing money
121-0.5
12.51.50Break-Even point. By exercising your option you will break even (0$ profit or loss)
1431.5You are now making a profit
1875.5To calculate your profit you would do
Stock Price – Strike Price – Option Price
buycall

Example 2: Writing a Call Option with a $11 Strike Price and an option price of $1.5 for 1 share in the contract (normally this is 100 shares per contract) and a current price of $10.

Stock PriceStrike Price – StockOption Profit/LossComment
0111.5As long as the option is out of the
money, the owner would not exercise it,
hence you make the option price.
1011.5
1101.5This point is called “at the money”
11.5-0.51The owner will now start exercising it and you
will be covering the price between the
strike price and stock price. You still make a dollar
12-10.5
12.5-1.50Break-Even point. By exercising your option you will break even (0$ profit or loss)
14-3-1.5
18-7-5.5To calculate your profit you would do
Strike Price – Stock Price + Option Price
writecall

As we can see above, when buying a call our loss is limited to the option’s price but when we write an option our losses are potentially infinite. With contracts of 100 shares each you can see how quickly you can lose very large sums by writing options.

Example 3: Bought put Option with a $11 Strike Price and an option price of $1.5 for 1 share in the contract (normally this is 100 shares per contract) and a current price of $10.

Stock PriceStrike Price – Stock PriceOption Profit/LossComment
0119.5In this case you are making
the most money you could
You would calculate with
Strike Price – Stock Price – Option Price
653.5
9.51.50Break even point
101-0.5The option is in the money but you still have a loss.
110-1.5The option is out of the money and the most you can lose is the option price
16-5-1.5
buyput

Example 4: Write a Put Option with a $11 Strike Price and an option price of $1.5 for 1 share in the contract (normally this is 100 shares per contract) and a current price of $10

Stock PriceStock Price – Strike PriceOption Profit/LossComment
0-11-9.5In this case you are losing
the most money you could
You would calculate with
Stock Price – Strike Price + Option Price
6-5-3.5
8.5-2.5-1.0The option is in the money still.
9.5-1.50Break even point
10.501Here the option is still in the money but are making a profit.
1321.5The option is out of the money and the most you can earn is the option price
1651.5
writeput

Below we can see just a few common strategies that can be accomplished by using a different combination of owning and shorting (selling) the option or stock, using a call or a put and varying the stock price. You can also create even more in depth strategies by varying the expiration dates of your options.

optionstrategies

Simulator Option Trading

If options trading is allowed in your contest, you can use the Options trading page.

Trading options on your simulator is easy but there a few differences between the real world and a simulator.

To trade options start by going to the Make a trade => trade options tab.

optiontrading0
  1. Simple or Spread: Simple is for one option whereas a spread will allow you two options that must both be calls or both puts with different strike prices.
  2. Action: Here you can select:
    Buy to Open: buy an option
    Buy to Close: Closes a written position (analogous to covering)
    Sell to Open: Opens a written position (analogous to shorting)
    Sell to Close: Closes a bought position
  3. Quantity: Enter the quantity desired of options contracts. Remember! Options contracts are for 100 shares so when you buy 1 contract for $1 each it will in fact cost you $100
  4. Symbol: This is the symbol for the underlying asset.
  5. Put/Call: Select whether you want a put or call
  6. Expiry: This can only be selected after selecting your symbol and put/call. This will select the expiry date of your option.
  7. Strike: This can only be selected after selecting the expiry date. This selects the strike price.
  8. Order Type: This will select if you wish a market, limit or stop order just as it would with stocks.
  9. Select preview and you can confirm your purchase.

Option nomenclature:

AAPL1504L85 is the way we write our options and can differ from other websites or brokerages.
Our options are written: Symbol Year Day (Call or Put and Month) Strike Price.

Call or Put and month:
A – L are for January – December Calls respectively
M – X are for January – December Puts respectively

Hence in the example above AAPL1504L85 : is an AAPL 2015 December Call for $85 strike price.

Final Note: It is always a good idea to double check the open interest and volume for options as they trade infrequently. The best and most reliable is directly from Chicago Board Options Exchange (CBOE).

Pop Quiz

[qsm quiz=61]

Definition:

Option holders have the right, but not the obligation, to buy or sell the underlying instrument at a specified price(strike price) on or before a specified date(exercise date) in the future. (this is different for European options as they can only be exercised at the end date). Exercising the option is using that right to to buy or sell the underlying instrument.

Example

Let’s say we wish to exercise 20 AAPL october 20th call options which have a strike price of 100$. We would let our broker know and he would then “use up” your option contract (hence it no longer has any value) and buy 20 * 100 (each option contract is for 100 shares) 2000 shares of AAPL at a price of 100$. This also means you have to have the money to be able to buy 2000 shares at 100$ = 200,000$. If AAPL is at 105$ you would then earn 10,000$ profit on this trade.

Brokers will often times allow you to simply take the profit as well just like you would at expiry by immediately selling the shares. Hence in the example above you would just obtain 10,000$ instead of needing the 200,000$ cash to have to purchase the stocks in the interim.

More Information

In general it is wise to avoid exercising options as you lose the time value of your option. This is not always the case and can be useful if you spot arbitrage opportunities. Traders can also take advantage of early exercise before dividend dates and other considerations.

On this simulator you can exercise options by finding the option you want on your Open Positions page and clicking “Exercise”.

Calculating your buying power can be tricky, and it gets trickier with more complex contest rules. This will be a quick primer on how to see exactly how your buying power is calculated, what affects it, and how to recover it when you want to make more purchases.

What is Buying Power?

Your buying power is the money you have available to use to purchase securities. It is NOT your cash balance. A number of things can affect how much buying power you have, but the basic idea is that you might have cash you’ve already set aside for another purchase, you might have the ability to borrow money for trades, or you might have some of your buying power tied up in “Margin Requirements”. Each of these items will affect your buying power differently.

You can review the rules for your contest on your Account Balances page, on the right side:

balances

Calculating Buying Power

The “complete” formula to calculate your buying power can be complex, depending on your contest rules, so we will start with the most simple forms and work towards the most complicated.

Contests With No Margin, Short Selling, Or Futures Trading

If your contest does not allow short selling or day trading, your buying power will be easy to calculate:

Buying Power = Cash – Open Orders

Your open orders are trades you’ve tried to place, but have not yet executed (for example, if you try to buy a stock while the markets are closed). If you have very low buying power, but lots of cash, chances are you have a big order sitting open. You can either wait for it to execute, or you can cancel the order to get your buying power back immediately.

You can see open orders on your Order History page:

order

Common Reasons Orders Will Be Open:

  • Orders placed after the markets close will not execute until the next morning when the markets open
  • All mutual fund orders execute around 6:00 pm New York Time (if they are placed before the markets close, otherwise they will execute the next business day at 6:00 pm)
  • You are trying to buy a security with very low volume – generally speaking, you can only buy as much of a security as trades in the actual markets (more or less, depending on your contest rules). This is especially relevant with Options trading, and penny stocks.

You can see the volume for the securities you’re trying to purchase on the Trading screen:

volume

Contests With No Margin Or Futures Trading, But Allow Short Selling

If your contest allows short selling, the mechanics work a bit differently. When you short sell a stock, you get cash immediately after the short sale, but this cash is held in reserve (you can’t use it to buy stocks), along with enough cash to “cover” your short (since you need to be able to repay the stocks you short sold). Click Here To Read Our Article On Short Selling.

In real life, you cannot short sell without a margin account, but since we allow it here, this is the formula used to calculate your buying power:

Buying Power = Cash – Short Sale Price of Shorted Stocks – Market Value of Shorted Stocks

Contests With Margin Trading, But No Short Selling Or Futures

Margin trading changes how your buying power is calculated by quite a lot: the idea behind margin trading is that you can borrow money from your brokerage, using your stocks as collateral. This means you can spend more than your starting cash, but you’ll be charged interest on the amount you borrow (the default is 8% annual interest, but this can be changed by your contest creator).

Buying Power = (Cash x 2) + Market Value Of Securities Purchased With Cash  

This means if you start with $100,000 starting cash, you’ll have $200,000 in buying power. If you spend all $100,000 in cash on stocks, you’ll be able to borrow an extra $100,000 using the stocks you bought as collateral.

Borrowing money on margin is automatic: once you use up all your cash, you will start buying on margin automatically if you keep trading. You can keep track of your loan balance on your Account Balances page.

Contests With Futures Trading, But No Margin or Short Selling

Futures trading is very complex: when you buy a futures contract, no cash immediately changes hands, but you make an agreement to buy a commodity at a future date at a certain price.

This means when you buy a futures contract, your cash will not go down, but your buying power will reduce by the amount that would be needed to fill your agreement on the future expiration date (which is called the “Margin Requirement”). The margin requirement won’t be the full contract price, only a certain percentage of the final contract’s price (usually between 2 and 10%).

For example, this quote below is for Oil futures:

future

This quote tells us that each contract is for 1000 futures (“Contract Size), and the margin requirement will be $4,510. So the buying power calculation is:

Buying Power = Cash – Margin Requirements

Where To Find The Components

We keep track of every component of buying power separately to help you see the calculations. You can see every component on your Account Balances page.

How Do I Build a Diversified Portfolio?

Understanding what it means to build a diversified portfolio is one of the first concepts a new investor needs to understand. When talking about stocks, diversification means to make sure you do not “put all of your eggs in one basket.”

What Does It Mean To Diversify?

Simply put, to “diversify” means to make sure pick a variety of stocks in different industries. History shows that at different points in time, different parts of the market outperform the others. At times the technology stocks perform well, sometimes its the banking stocks, sometimes its international stocks, sometimes its defense, sometimes its medical, etc. Since it is difficult to predict which industry is going to perform the best in the future, the best thing to do is to just own a few stocks in each industry so that you always own some of the top performing stocks. This way, over time, your portfolio returns are less volatile and, hopefully, always positive.

With real money, most advisers would recommend you have about 30 stocks in your portfolio, but with your virtual portfolio, you should try to have at least 10 stocks in your portfolio and those stocks should be from at least 5 different industries.

Why Do People Diversify?

Investors diversify because it helps to stabilize a portfolio’s return, and the more stocks you own, the more likely you are to own a stock that ends up doubling or tripling in price.

For example, if you own an equal dollar amount of 10 different stocks, and 9 of them stayed at the same price but one of them doubled, your portfolio would be up 10%.

People invest in the stock market because they want to make more money than they could make if they just left the money in the bank. Investors especially do not want to LOSE money. “Capital Preservation” is the idea that you want to preserve the money you have invested; investors never want to be in a position where it would have been better to not have invested at all. So to make sure that they are protected from price swings from any single stock or industry, investors try to maintain a fully diversified portfolio.

How Does It Work?

When you diversify your portfolio, you make sure that you never have “too many eggs in one basket.” If one of the stocks you have invested in starts to go down in price, you have limited your exposure to that stock by only having a smaller percentage of all your assets in that stock. For beginners, this can mean having no more than 20% of your portfolio in any one stock, ETF, or mutual fund. With real money, as you invest more money into your portfolio and as your portfolio grows in value, you should keep buying different stocks so that eventually you have less than 10% of your money in any one stock, and less than 20% of your money in any one industry.

For example, if you are investing in stocks in the Banking, Energy, Healthcare, Manufacturing, Luxury and IT industries, you would try to spread your money as evenly as possible across these industries. This way, if the Energy industry as a whole starts to have problems (for example, if the price of oil falls quickly), you don’t have to worry about your entire portfolio, and you have limited the losses you are exposed to from a single market shock.

Types of Diversification

There are 2 main types of diversification to think about as you first start investing:

1. Sector/Industry Diversification

To “diversify by sector” means that you would split your investments across companies based on the type of business they do; “Energy” companies would be oil producers, electricity companies, and companies that specialize in transporting materials needed for energy production. “Manufacturing” companies are firms that build everything from toys to cars to equipment to airplanes.

An example of a portfolio that is diversified between several sectors

The idea behind sector diversification is that if there is some larger trend that negatively affects an entire industry, you would want to make sure not all of your investments are affected at once. For example, low oil prices caused a general decline in energy stocks (of course, with some companies still growing, and others hit especially hard).

If you’re looking for a good way to find stocks in different sectors, Click Here to see how to research stocks by sector.

2. Stock Diversification

This is the most basic type: just making sure you don’t have too much money in any one stock. For example, if you want to put 10% of your money in the banking sector, that doesn’t mean you should put 10% of your money in Bank of America. You should have a few bank stocks in case one of your bank stocks is poorly managed and it goes bankrupt. Individual stocks are more volatile than sectors, and sectors are more volatile than entire security types, so this is the core of all diversification.

Asset Allocation

Asset Allocatoin means owning a variety of investments like real estate, stocks, bonds, gold/silver and cash. Yes, cash is an investment! For many years, the rule of thumb was to subtract your age from 100, and have that percentage of your overall value invested in stocks (so if you are 18 years old, you would invest 82% of your portfolio in stocks).

The idea is that over time stocks have consistently outperformed other investments so therefore the younger you are, the more you should be invested in stocks. As you get older and closer to retirement when you will rely on your investments, you have less time and you should prefer the low but consistent returns of bonds and cash. Another way of putting this is that younger investors are more risk-tolerant and older investors are more risk-adverse.

This line of thinking is getting to be a little out-dated, with the rising popularity of ETFs, more choices for mutual funds, and the ability to invest in riskier bonds, but the idea of making your portfolio more risk-averse over time can still be a good idea.

Asset allocation is different from diversification – you might have a wide asset allocation, with almost no diversification!

For example, if you divided a $10,000 portfolio between 3 asset classes (Stocks, ETFs, and Mutual Funds), you could have the following holdings:

  • Stocks – Celgene Corporation CELG and UnitedHealth Group (UNH)
  • ETF – Spdr S&p Biotech Etf (XBI)
  • Mutual Fund – Vanguard Health Care Fund (VGHCX)

You might be divided between 3 asset classes, but the entire portfolio is still concentrated on Healthcare/Biotechnology, so it is not diversified at all.

Ways To Stay Diversified

Exchange Traded Funds (ETFs) and mutual funds are good places to start investing because the securities are diversified themselves. ETFs and mutual funds take money from investors and invest that money in a variety of securities that meet the stated objective of that fund.

Some funds invest in large companies, some in European companies, some in utilities, some in commodities like gold and oil, etc. For example the ETF FHLC is a collection of Health Care stocks. If you are looking for an easy way to invest in a particular industry, without having to research which particular companies you want to choose, this is a quick route to take.

Warning About Over-Diversification

Diversifying is good, but don’t go too far! If you start diversifying too much, your portfolio starts to get “thin”; you might not lose much if one company starts to go down, but you also won’t gain much if another company you own starts doing very well. Beginners should usually build their first portfolio with between 8 and 10 stocks, ETFs, or Mutual Funds at a time. You can always switch the investments you have, but try to avoid having too many, or two few, investments at once.

Over-Diversification can also make it more difficult to manage your investments; if you are not able to follow up with company news and stay on top of your investments, things could start turning bad, and you could start losing one before you even know why!

Pop Quiz!

[qsm quiz=13]

Definition

A stock quote gives essential information about a particular stock at a point in time.  The quote normally includes information such as the name of the company, the ticker symbol, the price, the day’s high and low prices, and the trading volume.

Details

Usually when you get a stock quote, you see lots of other information about that company and that stock price. The most important thing to note is the time-stamp that shows you how old the stock quote is. The other important pieces of information a stock quote shows is the day’s high, low and volume, and sometimes the 52-week high and low.

Parts Of A Quote

Take a look at the quote above – here is the information you can find:

The Basic Quote

The top of the chart has the “basic quote” – you can also find this information on the trading page after you enter a symbol. The biggest number is the “last price”, $204.41 in the example above. This is the last price the stock traded at in the real world.

You can also find:

  • Day’s Change (how much the stock price changed in the last trading day)
  • Bid/Ask price (how much buyers and sellers in the real market are willing to pay for this stock)
  • Time Stamp (when this quote was issued)
  • Volume (how many shares of this stock traded so far today, or the last trading day)

The Stock Chart

Stock charts show how the price of the stock has moved over time. Most stock charts give options for different time scales, so you can see the stock’s price movements for the current day, most recent month, or longer-term trends.

The Dividend Rate, Dividend Yield, and Ex-Div Date

Companies that are consistently profitable often pay out part of their earnings to shareholders.  This is called a dividend.  In the image above, Apple pays out $0.63 per share per quarter. The Dividend Yield is the percentage of the stock’s price that is paid out in dividends per year, so we can calculate that the $0.63 quarterly dividend is $2.52 annually.

The Ex-Div Date is the date the last payment was based on.  You had to be a shareholder at the close of business the previous day to get that dividend.  Most companies pay dividends quarterly but list the annual amount.

Bid and Ask Price

The Bid Price is the highest price a buyer is willing to pay for the stock; the Ask Price is the lowest price a seller is willing to sell the stock.  If you place a Market Order to buy the stock,  your order will get executed closer to the Ask Price.  If you place a Market Order to sell the stock, your order will get executed closer to the Bid Price.

Prices shown are often delayed 15 minutes because of stock exchange rules.

Schedule a call

Get PersonalFinanceLab

This lesson is part of the PersonalFinanceLab curriculum library. Schools with a PersonalFinanceLab.com site license can get this lesson, plus our full library of 300 others, along with our budgeting game, stock game, and automatically-graded assessments for their classroom - complete with LMS integration and rostering support!

Learn More

[qsm quiz=19]

Definition:

A “Ticker Symbol” is a unique one to five letter code used by the stock exchanges to identify a company. It is called a ticker symbol because the stock quotes used to be printed on a ticker tape machine that looked like the images below. When it printed the stock quotes, it made a tick-tick-tick sound!

Caution:  When you are researching a company, don’t be tricked into thinking that the ticker symbol is just an abbreviation of the company name.  Sometimes it is very different.

For example, here are some popular and interesting ticker symbols:

TickerCompany
WMTWalmart
AAPLApple
DOWDow Chemical
FFord
TickerCompany
LUVSouthWest Airlines
HOGHarley Davidson
BUDAnheuser-Busch
KOCoca-Cola

How Do Companies Pick Their Tickers?

It depends on who is in charge! Companies can choose whatever they want to be their ticker symbol, so long as it is not already taken, and the regulators do not think it is misleading (in a famous case, a company was prevented from choosing “FBI” as their ticker).

Usually companies try to pick a ticker that could be an abbreviation for their company to make it easier for investors to find. Other times, the connection is less obvious. In the examples above, we have:

  • LUV, for SouthWest Airlines. They chose this ticker because their business started at Love Field, an airport in Texas.
  • HOG, for Harley Davidson. Motorcycle fans will often refer to Harley motorcycles as Hogs, which they borrowed for their ticker.
  • BUD, for Anheuser-Busch. They are a brewer, and their biggest beer brand is Budweiser, which they used for their ticker.
  • KO, for Coca-Cola. CO was already taken when Coca-Cola first became a public company, so they chose the next-best sounding ticker.

Companies will usually choose the shortest possible tickers, since longer tickers seem like “newer”, less-established companies.

Why Do We Use “Tickers”?

Most beginning investors find it confusing to use ticker symbols because before you can begin to do any stock research, you must look up the ticker. And when you do look up tickers, you will often be surprised how many companies there are that have very similar names. Make sure you are buying the stock that you think you are buying. Ticker “COKE” is not the Coca-Cola Company!

Wouldn’t it just be easier if we used the company names? We try to help this with our Smart Trade Drop-Down, where by typing the company name in the trading window, we will give you tickers that match (Click Here To Try!).

However, lets take a look at where ticker symbols came from, and why we still use them today.

Early Tickers

Ticker machines first came into use during the late 1800s as a fast way to move news across far distances; they used telegraph lines to transmit messages electronically. However, with a telegraph machine, each letter of the message had to be spelled out in Morse Code (a series of dots and dashes), read by the operator on the other end, and then typed out onto a message to be actually read by anyone.

This was a time-consuming process; the longer the message, the longer it took to write, translate, and read. To speed things up, shorthand writing (the predecessor of today’s “text speak”) was invented. Famously, an old British admiral was the first person to use “OMG” as shorthand in a message to one of his colleagues.

For investors looking to get the latest stock prices, this was also a problem. Since there were hundreds of companies being traded and prices being updated every minute, the longer it took to communicate a company’s price meant the whole stream of information was held up. Thus, company names were shortened down to 1-5 characters, and the first ticker symbols were born.

Rise of Electronic Trading

Today, the original reason for tickers is still important; computers still take time to process longer names, so shorter codes can be a lot faster when executing billions of trades per day (if you are making trades as fast as you could, it would take almost 5 times as long to write “The Coca-Cola Company” than it would “KO“). There is also another reason why we continue to use tickers: sometimes companies have multiple “types” of stock, or multiple companies have very similar names.

Classes of Stock

There is also another reason why we continue to use tickers: sometimes companies have multiple “types” of stock, or multiple companies have very similar names.

For example, Google has stock both under the symbol “GOOG” and “GOOGL“. These stocks are very similar, but they were issued at different times and have different prices, since each share represented a different “slice” of the company, and have different rights for investors.

Sometimes you might see a “.A” or “.B” after a ticker symbol – this usually indicates a class A or class B type of shares. Companies may occasionally issue different classes of shares if they issue stock more than once – and each class of shares represents a different percentage ownership of the company.

SymbolCompanyDescriptionDifference
BRK.ABerkshire Hathway – Class AWarren Buffet’s company – original issue of sharesCore Berkshire – Hathaway stock, work about $250,000
BRK.BBerkshire Hathaway – Class BWarren Buffet’s company – second issue of sharesSecondary shares issued later, for 1/1500 of one share of BRK.A
GOOGAlphabetAlphabet (Google)’s original stockAfter 2012, these are “non-voting” shares
GOOGLAlphabetAlphabet (Google)’s new stockAfter 2012, these stock holders can vote in shareholder meetings

You can see there are a few reasons to have different classes of stock. Berkshire Hathway’s stock shares are worth smaller percentages of the company (and so the “B” shares are worth much less than the “A” shares). Alphabet (Google)’s shares are technically worth the same “slice” of the company, but only the GOOGL shareholders can vote in shareholder meetings to determine the company’s direction.

How to Find a Stock’s Ticker Symbol

On most financial websites, you will find a QUOTES or GET QUOTES link.  When you click on those links, it will take you to a stock quote screen.  Usually there is a link on that page that says TICKER SYMBOL LOOKUP or similar.  If there is not a ticker symbol lookup link, then try just typing the company name in and some pages will show you related tickers.

You can look up any ticker here by simply typing the company name into the “symbol” box on the trading page, or by going to the “Quotes” page.

Pop Quiz!

[qsm quiz=18]

Why Invest in Stocks?

Once you have built your budget and built up your emergency fund, you will start to build up extra savings that go towards your future – and that future should include investing.

Simply put, when you have money to invest for an extended period of time (like 20 years or more), the stock market historically has provided the greatest return.

When most people are able to save money, they usually put it in the bank. Banks usually pay interest on the cash in your account, so if you have $1000 in your savings account and the bank pays you 3% interest then at the end of a year you will have about $1030. Once the savings balance gets bigger, a lot of people hope to earn more than what the bank is paying in interest, so they invest in real estate, stocks, bonds, and/or gold.

Historical Returns of Investments

While no one knows for sure what will happen in the future, a look at historical returns shows how these different investments have performed over time.

Here’s a chart of average percentage returns for the 30 year period from 1988 to 2018:

Data Source: Portfolio Visualizer.com
InvestmentDescription
US Stock MarketThe average of all stocks trading in the US
US Large CapThe average return of the biggest companies in the US (big companies that most people have heard of)
US Small CapStart-Up stocks – these have higher risk than bigger companies, but can also provide bigger rewards.
Short-Term TreasuryUS Government bonds that expire in less than 5 years (and so your money gets “locked up” for a short period of time)
Long-Term TreasuryUS Government bonds that expire in more than 5 years (and so your money gets “locked up” for a long period of time)
Long-Term Corporate BondsBonds issued by companies for more than 5 years. The return is lower than stocks, but is also less risky (since if the company goes bankrupt, bond holders get paid before stock holders)
High Yield Corporate BondsBonds with either very short duration (usually less than 5 years), or bonds on companies that are considered “Risky” – they have a high chance of going bankrupt
Real EstateInvesting in property and buildings, either to rent out or to re-sell at a higher price
GoldBuying gold bars and coins

From this chart we see that the stock market has performed the best – between a 900% and 1100% increase, depending on the security types. Gold performed the worst – one major reason being that gold tends to go up in price during years where there is low inflation, and down in years with high inflation.

So what does that mean? Over time there is a HUGE difference between 10% and 2%. Here is another way to look at it–this chart shows the growth of $100 for the 46 years from 1972 to 2018.

So, would you rather have $401 or $1,612! That’s a big difference for just $100. For $10,000 the results would be exactly 100x or $40,100 versus $161,200.

Finally, this chart looks at average returns from 1986 through 2018 and shows that the S&P 500 stocks were the best return, with a 12% average annual return – beating out both the large-cap stocks in the Dow Jones Industrial Average and the Small-Cap stocks in the Russell 2000 index.

In this table you also need to note the Standard Deviation column which measures the variance or volatility of the returns. Volatility means how much the stock’s price goes up and down in a short period of time. Long-term investors do not like volatility – most investors prefer to have their retirement account grow at a slow, but constant, rate rather than having huge spikes followed by huge losses.

It shows that Small Stocks also have the highest variance. This is why we say “over time” that stocks have the highest returns. If you looked at just one year or even five years, you might not see the same results because stocks are so volatile, but the longer the time period you have to keep the money invested the better it is to invest in stocks.

Summary

Simply put, if you want to maximize your personal net worth, if you want to be “rich”, if you want to be a “millionaire”, if you want to retire early–you must start saving and investing TODAY.

The earlier you get started, the more time your money has to grow.  And the more time it has to grow, the bigger it will become.

Understanding how the stock market works and how to invest is so important because it determines how much your net worth will be when you retire.  Are you going to leave your cash in your savings account at the bank all your life and earn an average of 3%?  Or are you going to invest it in the stock market and try to earn 11%?

Pop Quiz!

[qsm quiz=17]

Definition:

“Wall Street” is a street in New York City, near the southern end of Manhattan Island. It is the home of the New York Stock Exchange, and the biggest center of stock trading and finance in the world.

History

Before New York was New York, it was a Dutch colony called New Amsterdam, which only took up a small area in the south of Manhattan Island. As part of the town’s defenses, in the 17th century a wall was built near the town center.

The street build along the wall was called Wall Street, and remained so even long after the walls were torn down and the city continued to grow.

Over time, businessmen began to meet near the old Wall, at a buttonwood tree near the intersection of Wall Street and Broad Street. By 1792, most of the young city’s investors would meet here to trade Revolutionary War bonds, bonds issued by various state and local governments, and a small amount of stocks from the growing businesses in the area.

Wall Street and the United States

Wall Street also had an important government function: in 1700, a new City Hall for New York City was built on Wall Street. As the American Revolution drew near, this building was also where the Freedom of the Press was established (with a lawsuit of the British government against a newspaper printer for libel, he was found not guilty because what he published was true), and where delegates from 9 of the colonies met to draft a letter to King George and the British Parliament in response to the Stamp Act, making the famous claim of “No Taxation without Representation”.

After the Revolutionary War, the city hall became Federal Hall, and served as the capitol of the United States from 1785 until 1789 (where, among other things, the Bill Of Rights was signed). After this, it became a customs house, and later part of the Treasury system. It is now a national monument.

Growing Business

In 1817, the businessmen who had continued to meet near the buttonwood tree to trade Revolutionary and United States bonds (along with small amounts of stocks) pooled their resources to rent an empty building across the street from their old meeting place so they could continue to meet even when it was cold and raining. This building became the first home of the New York Stock Exchange.

Pop Quiz!

[qsm quiz=16]

Definition:

The New York Stock Exchange (or NYSE) is the largest stock exchange in the world. Think of it as an organized, fast-paced flea market where buyers and sellers from all over the world come to trade U.S. stocks (and now some foreign shares as well). It is where over 2,800 of the biggest U.S. companies have their shares listed. On average, over 1 billion shares are traded each day. It is located on Wall Street in New York City.

New York stock exchange facade with USA flags

History

Before the New York Stock Exchange became as powerful as it is today, it started as a group of merchants meeting near a buttonwood tree in the late 1700s to trade bonds (from cities, states, and even revolutionary war bonds), and a few stocks from the growing businesses in New York City. These merchants met near the intersection of Wall Street and Broad Street until they pooled their resources in 1817 to rent a building on Wall Street so they could continue to meet and get out of the cold and rain. This building became the first New York Stock Exchange (NYSE).

During the 1800s, the industrial revolution began sweeping across the country and the NYSE was at the center of financing its growth. Thousands of businesses were started and needed access to cash to finance their growth. Many of them sold stock on the NYSE to raise capital to build factories and expand. The first half of the 19th century also saw a huge boom in canal building; canal construction was financed usually partly through government funding (which was raised by selling bonds) and by selling stock in the canal companies to investors (which was sold in stock that paid dividends based on the canal tolls once completed). By the 1840s, canal companies were replaced with railroad construction, which was almost entirely funded by the sale of stock.

It was during the railroad boom that the NYSE transitioned from being centered around bond trading to being mostly focused on the buying and selling of stock. However, it was not just because of the railroads that this transition took place: the invention of the telegraph allowed the news of stock prices to reach investors immediately, rather that waiting for newspapers and other publishers to compile lists at the end of the day or week (which often would not include anywhere near all of the stocks currently on the market). This also allowed buyers and sellers across large distances to trade relatively easily, since it could be done through brokers in respective cities who specialized in trading.

The industrialized companies with their huge growth (and so potentially very valuable stocks) were the biggest reason investors on Wall Street began to move into stock trading rather than bonds. With a bond, the yield is usually based on the likelihood that whoever is borrowing the money will “default”, and fail to pay it back. Stock prices are based on the expected future profits of the business they represent ownership of. Before the industrial revolution, most businesses outside of very large trading organizations grew very slowly and usually did not issue any public stock at all. For most investors, buying bonds was either risky (because of a risk of default) or had fairly low yields, and was the only option available. Industrial companies often promised big growth and big profits, and were eager to sell shares to the public to raise capital quickly (so they could start business faster), encouraging new investors to take part. The huge boom of growth in canal and rail stocks carried over to other industries, and has grown ever since.

The NYSE was the center of some of the most important economic events in the United States, including the extremely well-known “Black Thursday” in 1929, which is one of the events that started the Great Depression.

The NYSE Today

The NYSE is still the largest stock exchange in the world, and will likely continue to be for a very long time. Traders from around the world still meet to trade on the NYSE floor, but as more and more trading by large financial firms is done completely electronically, and more individuals are trading stocks using their online brokerage accounts, the NYSE and Wall Street act as a global symbol for investment and the financial world.

Pop Quiz!

[qsm quiz=14]

What is a Stock?

Stock is defined as a share of ownership in a company.  If you own a company’s stock, you own a percentage of the company itself.  This includes partial ownership of its assets (like equipment, vehicles, and buildings) and partial ownership if its income and profits.  The main reason people purchase stock is because they believe in a company and its current success and they want to be part of the company’s success down the road, hoping to share in the increased profit. 

Large companies who have many investors issue “stocks” or “shares” to the investors as a way of showing ownership. In the past, if you bought 100 shares of a company, you might get a stock certificate like the one pictured below indicating your ownership. When you decided you no longer wanted to own those shares, you would notify your broker of your intent to sell, send your certificate to him, and he would try to sell them to another investor who might want to own part of that company. In today’s technology-driven world, companies are more likely to issue electronic or digital shares. Electronic shares are easy to trade because the broker doesn’t have to wait to receive the stock certificate from the investor. This process of buying, selling, and trading is the essence of the stock market.  It is where investors invest in new companies, or they buy and sell (exchange) shares when they agree on a fair price.

Example physical share of stock in the Walt Disney Company (DIS)

Definition

Stock is defined as a share of ownership of a company; if you own a company’s stock, you actually own a percentage of the company itself (including its assets, like chairs, vehicles, and buildings) and a percentage of its profits. For example, if a company issued 1,000 shares and you owned 100 shares, that does not mean that you can go to the company headquarters and take 1/10 of the furniture. It means that if the company was profitable and they made $100,000 and decided to pay it out to the shareholders, you would get 1/10 of $100,000 which is $10,000. People invest in companies that they think will be profitable with the hope that the company will start paying out its profits to its shareholders. Likewise, if the company was not profitable and decided to close, then the company might just sell all of its furniture for $1000 and you would only get $100 back.

What Does Owning Stock Get Me?

Let’s look at an example to help you understand how stock ownership might work for you.  If a company issued 1,000 shares and you owned 100 of them, you would own 10% of the company.  That does not mean that you can go to the company headquarters and take 10% of the furniture. It means that if the company was successful, made $100,000 profit and decided to pay it out to the shareholders, you would get $10,000 (10% of the $100,000). However, if the company was not profitable and decided to close, then it might just sell all of its furniture for $1000, giving you $100 (10% of the $1,000). 

As an investor in the stock market, you will get a much smaller percentage of a complete company. Take Apple, for example.

Apple has approximately 5.575 BILLION shares outstanding, so if you owned 100 shares of Apple, you would own 0.00000179% of the company. That seems like a tiny amount, but keep in mind that Apple makes $50 BILLION a year so if they paid out all of their earnings one year, you would get $896!

If you decide that you no longer want to own your Apple shares, you can always sell your shares on one of the stock exchanges.

Types Of Stock

There is more than one kind of stock or ownership that companies sell. While almost all stock traded on the stock exchanges is “Common Stock”, some companies have issued “Preferred Stock”.

Common Stock

Common stock is the kind most investors buy. Common stock generally gives one vote at shareholder meetings for every share owned.

Common stock holders may also be entitled to receive distributions of the companies provides, called “dividend payments.” For larger, more stable companies, a portion of corporate profits is usually paid back to shareholders 4 times a year as a dividend. Companies that are still growing usually pay no or very little dividends; but well established companies like utilities generally pay higher dividends.

Preferred Stock

Preferred stock generally does not have voting rights, and you generally will not find them trading on an exchange. However, preferred stock shares have the benefit of “preference” for dividend payments; if a company decides it is going to pay dividends, preferred stock holders may get a bigger share, and be paid before common stock holders. Preferred stock holders are also entitled to be paid first if a company goes bankrupt and all the assets are sold off.

Example share of a preferred share of stock in a railroad company

The Difference Between Stock and Bonds

When you buy a stock, you are buying a piece of ownership of a company. A bond, however, is more like a loan or debt; a bond is a promise that a company makes to pay you back the amount you lent them plus interest. Hence, if you own a bond, you are only lending a company money, but if you own a stock, you own part of the company itself.

Where Does Stock Come From?

New stock in a company can come from two places: New Issues and Stock Dividends (or Splits)

New Issues (Initial Public Offering)

A new issue of stock is when a private company decides to “Go Public”, and issues shares of stock for anyone to buy. This is often called an Initial Public Offering, or IPO, and when large private companies go public, it can be a very exciting event with huge fluctuations in the stock’s price in the first weeks while the market decides on a fair price for the shares.

Private companies “Go Public” and issue stock primarily to raise money: as they sell the shares in the company, the original owners allow the public to vote on some management decisions in exchange for the cash raised in the stock sale to re-invest and help the company grow.

Stock Dividends (Splits)

Companies may also issue new shares of stock after the IPO. This can be done by giving all current shareholders additional shares in proportion to how many shares they currently have; for example they can say that for every 10 shares you own now, they are issuing you one extra share.

This would be a 10% stock dividend, and the market price for the stocks would drop by 10% (although all shareholders still have the same ‘value’).

If the stock dividend is large enough (usually about 20%), it is instead called a “Stock Split”. There are many reasons why companies would want to have a stock dividend or split, but they usually happen for one of two reasons:

Attract Attention and Increase Trading

Companies may split their stock to attract attention to the company through the hype that can come from a stock dividend. However, the simple act of there being more shares in circulation may encourage people to buy and sell more, since each individual share takes up a smaller percentage of a portfolio

Lower The Price

Some large companies like to have their stock price stay in a certain range. One reason for this is that the more expensive a stock, the fewer people who can afford to buy it (or buy an additional share), so splitting stocks can help it become more affordable, and increase the total value of all stocks in the long run.

Short History Of Stocks

Stocks trace their origins back to the Roman Empire, where large, private companies that carried out some public duties would sell shares of stock to Roman citizens for the same reasons companies do today; raise cash and grow their business.

Over the centuries, Joint Stock Corporations were often chartered by Kings for large projects that the government simply did not want pay for; for example many canals and railroads were built by Joint Stock Corporations; private investors willing to to take the risk that a project that might fail in exchange for some of the profits if it succeeded.

During the Age of Exploration, joint stock corporations funded explorers to voyage across oceans, and later ship goods across continents. The British East India Company is perhaps the most famous of these, which was involved in everything from the exploration of Canada and the Americas to the British conquest of India.

Stocks and Risk

Investing in stock is risky.  There’s no guarantee that a company will be successful.  Companies strive to be profitable, but they also face unexpected events which can impact their bottom line and impact investor confidence.  So when you decide to purchase stock, be prepared for some ups and downs.

Pop Quiz!

[qsm quiz=9]

The most challenging aspect of starting to invest is picking the first few stocks to add to a portfolio. Every investor has their own techniques and strategies, but we want to give you the tools you need to place your first trades, and get your portfolio off to a running start.

Establish Goals

Before choosing your first stock, the first step is deciding what your goals are for your portfolio.

Risk and Reward

The biggest choice you will make will be balancing risk and reward – investing all your cash in very risky assets with high growth (or loss) potential, or focus on companies that you believe can be strong in the long run.

Riskier stocks are ones that have a lot of price movement. This can include biotech companies that are trying to develop a new product, companies that have just IPO’d, or many tech stocks that move up and down depending on today’s news. Less risky stocks include utility companies and old, established businesses with relatively stable revenues over time.

Diversification

Once you consider how risky you are feeling, next decide how you want to diversify your portfolio, which will help you decide how much cash to invest in each symbol. If you are building a portfolio in the stock game, your teacher might have a rule forcing you to diversify with a “position limit”, meaning you can only invest a certain percentage of your cash in any single stock. You can check if your contest has a Position Limit rule on the Account Balances page.

Once you establish the minimum number of securities you need, you can now start handpicking stock symbols by using a trading strategy. You can also create a mix of these strategies to get the best of each strategy.

Trading Strategies for Beginners

“Invest in what you know” strategy

The best way to start when buying stocks is to buy what you know, not trying to follow stock tips or read a bunch of technical analysis that you cannot follow. Think of it this way: if you already know a company, they have done well enough in the past to already become a household name today. This gives you, as the investor, a big advantage; you can see how that company is doing just by looking at their stores and reading normal business news.

Ask yourself the following questions:

  • Have they started to open new stores around me lately, or are they closing some shops?
  • Does there seem to always be a lot of people you know using their products, or are they still more obscure?
  • Does their current news look positive or negative?

If all three of these are positive, then this might be a good place to invest.

Earnings Strategy

An investor can always handpick stocks based on the earnings calendar. To do so, you would have to know your investment time horizons, and flip through the earnings calendar to find gems (i.e. stocks that you can buy and that will soar during its earning season, or stocks that will tank and that can be shorted beforehand).

The Earning Strategy is somewhat of an evolution of the “Invest in what you know” strategy – you will be looking for companies that you believe will have high earnings announcements coming up soon, which can cause their stock price to rise.

Once you have found your stocks, it is very important to analyze them and back-up your assumption of how the market will react to their earnings report.

An example of a well executed trade based on the earnings’ expectations would be NVDA. Before the presentation, NVDA was trading around 102 and soared continuously every since to 149.44 on the 7th of June!

The Passive strategy

If you are not sure which specific stock to select, you can always invest in ETFs and market indices. These products are already diversified for you and will track a specific market for you.

As an example, let’s say you want to invest in a gaming company, but don’t know which company in specific. You can always invest in an ETF that will track the gaming market for you. In this situation, you can invest in the PureFunds Video Game Tech ETF (GAMR), which tracks this market for you. Based on their website, they have invested in gaming software firms such as Ubisoft, Activision, Konami, etc., which means the stock picking and allocation tasks has been already taken care of by the Fund Managers of this ETF.

You can find a specific ETF in the following link:  http://www.etf.com/etf-lists.

Stock screeners strategy

You can also use stock screeners to find good purchases and short sales. A Stock Screener is a program or website that will ask you some questions about what you are looking for in a stock, and return a list of stocks that match your criteria. You can then do extra research on these stocks to determine if they should be added to your portfolio. You can find our stock screener under “Research” on the main menu, or by clicking here.

Getting Trading Ideas

We also have a “Trading Ideas” page that will help you review the overall market’s health and help you adjust your stock picks. The “Trading Ideas” page has the latest market news, and a rotating list of the most popular stocks and mutual funds from other students (along with links to get more information on each!)

Research Page – Markets

On the right side of the Quotes/Research page, you can also find a section for “Markets”. This has some great information to find trading ideas as well.

Today’s Market Summary

This page is very useful for the start of your research. It presents the day’s market summary. It is useful because it tells you how the overall market is doing today. As an example, on May 17th, 2017, you would notice that indices such as SPY dropped 5 points due to the “Trump-Russia” investigation. This can be used as a signal to certain investors to buy more. If an investor purchased SPY during the dip, he/she would have gained more than $5 per share! It is always important to review how the overall market is doing and the market news today. This can help you to capture the perfect timing to buy stocks at their lowest price (or to short sell them at their peak).

Market Movers

Market movers is a great place to look for some quick stock picks. These are the stocks that have gone up the most or down the most so far this trading day – and you can filter by NYSE, NASDQ, or other exchanges.

If you see a ticker symbol you recognize, look up their quote to see the news on why they are moving – it might be a great opportunity to buy (or short).

Top Performing ETFs

If you do not like picking individual stocks, ETFs might be a better match. Exchange Traded Funds, or ETFs, are “themed” funds – there are ETFs specializing in oil, video game companies, the entire market as a whole, and everything in between. Check the top performing ETFs page to see which types of ETFs are “hot”, and which types to avoid.

Analyst Ratings

If you look up the quote for any company, there is also a tab called “Analyst Ratings”. This will give you information about what other analysts on Wall Street are saying – along with whether they think it is time to buy or sell.

Pop Quiz!

[qsm quiz=12]

Mutual Funds are a way you can buy into a wide range of stocks, bonds, money markets, or other securities all at once. They are professionally managed, so you are basically buying a piece of a larger portfolio.

Definition

Mutual Funds come in several different “flavors”, but the core concept is always the same: the fund is a pool of money contributed from many different investors that are used to purchase a bundle of securities. All contributors to the fund are given shares in proportion to how much they contributed, and they receive returns based on the performance of the underlying security.

Mutual funds are also sold in shares, just like stocks. However, unlike stocks, there may or may not be a limit to the number of shares outstanding at any given time (depending on the type of mutual fund), and it can be very common to own “fractions” of a share of a mutual fund.

Types Of Mutual Funds

Mutual Funds typically fall into one of three categories: Open Ended, Closed Ended, and Unit Investment Trusts.

Open Ended Mutual Funds

“Open Ended” means that there is no limit to the number of shares of these funds that can exist at any given time; however much money investors have contributed will be issued shares, and that will be used to buy more underlying securities. Investors can also cash out any day they want, selling off their shares in the fund at the market price for that day.

This also means that investors cannot day trade mutual funds; since the actual distribution of assets is managed by professional portfolio managers, the actual value of each share is not precisely known until the end of the day. Investors can only buy and sell their shares from the fund managers themselves, not trade their shares on the open market.

In practice, this means that you buy open-ended mutual funds for a fixed dollar amount, rather than as a number of shares. You will actually receive these shares at the end of the day (almost always 6:00pm New York Time), and so you will almost always have a decimal value (for example, 10.1252342 shares). Conversely, when you want to sell your shares, your order will execute at 6:00pm New York Time, when the transactions for the fund settle.

Closed Ended Funds

“Closed Ended” means that there is a fixed number of shares, and so these funds can trade on exchange (similar to an ETF). These funds are still professionally managed, but the total amount invested is determined only once; at the Initial Public Offering.

Unit Investment Trusts

These are much less common than the other types of funds, and are also closed-ended. These funds are special in that they have a limited lifespan; they are issued once, but the fund eventually “expires” and all investors are paid out based on their investment and the return of the underlying assets. These funds are also special in that they are not professionally managed: the holdings are determined at the Initial Public Offering and are fixed while the fund is active. However, investors can redeem their shares from the fund managers at any time, or even sell shares on the open market (although this is very rare).

Advantages To Using Mutual Funds

Mutual funds can be a very easy way to “diversify”, since there are many different types of mutual funds it is usually possible to find a selection to complement your portfolio. Mutual funds have historically been an important part of retirement planning; since the funds are professionally managed, they do not require as frequent attention compared to a portfolio of stocks you actively pick, buy, and sell.

Mutual funds also “pass through” dividends to their shareholders; if a stock owned by the mutual fund pays a dividend, it is paid directly to the mutual fund shareholders.

Disadvantages To Using Mutual Funds

The biggest disadvantage is that the professional management of the fund comes at a price; mutual funds generally charge a fee based on the initial capital invested. This can add up quickly, especially if the fund is underperforming, (a major issue with retirement accounts during the financial crash was that mutual funds will still charge fees on your capital even if the value of the fund itself is decreasing, acting as a double-penalty).

Another major disadvantage is that you have no option to customize the holdings of a mutual fund; you are stuck with what the fund manager chooses. Of course, you should always diversify your portfolio outside owning a single (or even multiple) mutual funds, but you could end up in a position where you are “shorting” a stock while simultaneously “long” in a mutual fund you own.

Differences with ETFs

At first glance, there is very little difference between a closed-ended mutual fund and an ETF: both trade on an exchange, and both hold a wide range of assets. However, there are some important key differences:

  1. ETFs are typically not “managed,” in that they typically have holdings mimicking a particular index, (for example, the S&P 500) and the fund managers do not actively shift the holdings outside that index. This means it is possible to “buy into an index” that you want to hold, and you will know the actual holdings of the fund, the Net Asset Value (NAV) at any given time.
  2. Because they are not actively managed, the fees associated with ETFs are typically much lower.
  3. The tax structure for owning an ETF is much more similar to owning stocks than Mutual Funds.

When choosing between ETFs and Mutual Funds, all of these are important considerations; because of the lower fees alone ETFs have become increasingly popular in the last 10 years. However, the fact that mutual funds are actively managed may make them more attractive to long-term retirement planning (depending on your personal tastes).

For a list of the most popular mutual funds, click here!

Trading Mutual Funds

If it is allowed in your contest, you can use the Mutual Funds trading page.

There are a few things to keep in mind when you’re buying or selling mutual funds:

1. When you buy a mutual fund, you’re buying a dollar amount, not a number of shares!

This is important: The NAV is not known when you’re actually making your purchase, (the quote at the bottom is the NAV at the last trading day). The quantity you enter is a dollar ($) amount. Then when your order executes, it will buy as much of the fund as you can afford with that amount.

2. Mutual fund orders execute when the markets are closed!

If you place a mutual fund order before 4pm New York Time on a trading day, your order will execute around 6pm. If you place your order after 4pm, or on a non-trading day, your order will execute around 6pm on the next trading day. If you place your order and decided against buying that fund, you can cancel your order on the Order History page.

3. You can own fractional shares of a mutual fund!

Since you’re buying a dollar amount, you will probably end up with fractional shares of a fund in your portfolio when your order executes. If you want to sell off your entire fund at once, click “Liquidate Position” on the trading page.

Pop Quiz!

[qsm quiz=11]

ETFs are a fairly new way that you can buy a large group of stocks, assets, or other securities all at once. ETFs trade just like stock; you can buy and sell shares of an ETF throughout the day on an exchange.

Definition

“ETF” stands for “Exchange Traded Fund”, which is exactly how it sounds; they are like mutual funds in many ways, but they trade on a normal stock exchange like a stock, with their value being determined both by the value of the underlying assets and the value of the ETF itself.

ETF funds are not usually actively managed, instead they work like an index; the fund is established to track a basket of stocks or other assets in a certain pre-existing class. An example is the Spider SPY ETF: this fund is based on the S&P 500. This means that all shares of the SPY ETF represents a small piece of shares in the 500 companies in the S&P 500.

Almost all popular stock indecies have an ETF that tracks them these days, but that isn’t the only kind of index an ETF will follow. There are also ETFs that are designed to follow commodities; for example USO and OIL are based on the price of oil, and companies that mine/refine oil, while GLD and SLV follow the price of gold and silver, respectively.

ETFs are very useful because it is an easy way to buy a diverse range of assets all at once; you don’t need to worry as much about trying to ‘beat the market’ if you can buy the SPY ETF and be very close to matching the market’s performance automatically.

Types of ETFs

There are many different types of ETFs, but they all have one thing in common; they are designed to track a pre-existing index of some sort. Here are some of the most popular ones:

Stock Index ETFs

These ETFs track an existing stock index and attempt to replicate its performance. For example, SPY tracks the S&P 500, QQQ tracks the Dow-Jones Industrial Average, and IWM tracks the Russell 2000. There can be several ETFs that track the same index, since ETFs are issued by individual companies, some companies may want to track the same index as another.

Commodity ETFs

There are also ETFs designed to follow a basket of commodities. These ETFs are very popular with investors that would like to buy oil, for example, but do not want to start trading commodity spot contracts or futures. Some ETFs in this category are OIL for Oil, GLD for Gold, and SLV for Silver.

Volatility ETFs

Volatility ETFs are much more complicated; they are based on the “fear” of the market at any given time. Volatility ETFs are generally based off the VIX volatility index, which measures how much investors expect the market to move over the next 30 days. These are more complex financial instruments, and while anyone with a brokerage account can buy them, they are more difficult to manage and use.

Inverse ETFs

These ETFs work by doing the exact opposite as the ETFs above; their goal is to do the exact opposite of the index they are tracking. For example, the Inverse S&P 500 ETF SH tries to go down by 1% every time the S&P500 goes up by 1%. They do this by short selling and other financial derivatives. You may be interested in an ETF if you think the index you are tracking will be going down in the short term; for example you could want to buy an inverse Oil ETF if you think the price of oil is about to fall. It is a very popular way of short selling for investors who do not have a margin trading account.

Leveraged ETFs

Leveraged ETFs use a complex set of financial tools to double or triple the index it tracks; for example JDST tries to triple the returns of the Gold index it tracks, on a daily term. This means that if gold goes up by 1% today, the JDST ETF will be somewhere close to 3%. The opposite is also true, so if the index goes down by 1%, the leveraged ETF will fall by 3 times that.

Inverse leveraged ETFs also exist, which double or triple the inverse of the index they track. For example DWTI is an inverse leveraged Oil ETF; when oil goes down by 1%, it tries to go up by 3%.

Difference between an ETF and Mutual Fund

There are a few main differences between the two, but the biggest one to keep in mind is that mutual funds are actively managed (meaning there is a portfolio manager and a team of analysts actively buying and selling securities in the fund to try to get the best return given the mutual fund’s purpose), while an ETF is not actively managed; it follows a pre-existing index. This means that the underlying assets of most ETFs do not change much; the makeup of an S&P 500 ETF is not going to change much over time. Some other important differences are:

  • ETFs trade on an exchange, just like a stock
  • ETFs may have a slightly different value than the Net Asset Value (NAV) of its holdings; this means that it may be possible to buy an ETF for slightly less than the value of the securities it represents, making an opportunity for profit through arbitrage
  • ETFs typically have lower fees than mutual funds
  • It is often easier to keep track of the underlying assets in an ETF, since they do not change as much as mutual funds

Other Details

Just like a mutual fund, if an underlying asset of an ETF that you own pays a dividend, it is transferred to the ETF holding members (so you may receive an ETF dividend payment). ETFs can also split; usually this will happen once per year, with all ETFs created by a company having their split at the same time.

Pop Quiz!

[qsm quiz=10]

Definition:

The Dow Jones Industrial Average, more frequently known as the Dow or the Dow Jones, is a stock market index made up of 30 of the largest publicly-owned companies based in the United States. It’s a price weighted index meaning that the index’s price is an average of the price of the 30 stocks that make it up. Though it’s price weighted, this does not mean that every time there is a split the index is completely changed, as they have factors to keep the value of the index consistent.

The Dow Jones Industrial Average was first calculated on May 26, 1896 by Charles Dow and one of his business associates, statistician Edward Jones. It is the second oldest U.S. market index, though the contents of the index have changed multiple times. Its purpose was as straightforward as it was revolutionary: At the time, everyone who wanted to know how the stock market was doing had to filter through numerous newspapers, journals, and hearsay, which was a huge amount of information that was very difficult to process. Dow and Jones built the averages as a “market thermometer”, so a casual observer could see whether the markets as a whole were moving upwards or downwards over a given day.

The average is not a simple average of the prices of all of its components; rather it is a weighted average taking into account the differences in stock prices of all companies it tracks, and measures the change of the group as a whole. By choosing the largest and most stable companies in each of the main industrial sector, the average acts as a stable indicator to how the markets as a whole are performing.

While there are not many companies in the Dow, it is made up of some very large, and very stable, Blue Chip Stocks. Since these businesses have proven their value over time, the ups and downs of the Dow can be a very strong indicator of investor sentiment across the entire economy.

Current Companies in the DOW:

SymbolCompany NameQuotes and Charts
AAPLApple IncClick here to get a quote!
AXPAmerican Express CoClick here to get a quote!
BABoeing CoClick here to get a quote!
CATCaterpillar IncClick here to get a quote!
CSCOCisco Systems IncClick here to get a quote!
CVXChevron CorpClick here to get a quote!
DDE I du Pont de Nemours and CoClick here to get a quote!
DISWalt Disney CoClick here to get a quote!
GSGoldman Sachs Group IncClick here to get a quote!
HDHome Depot IncClick here to get a quote!
IBMInternational Business Machines CorpClick here to get a quote!
INTCIntel CorpClick here to get a quote!
JNJJohnson & JohnsonClick here to get a quote!
JPMJPMorgan Chase and CoClick here to get a quote!
KOCoca-Cola CoClick here to get a quote!
MCDMcDonald’s CorpClick here to get a quote!
MMM3M CoClick here to get a quote!
MRKMerck & Co IncClick here to get a quote!
MSFTMicrosoft CorpClick here to get a quote!
NKENike IncClick here to get a quote!
PFEPfizer IncClick here to get a quote!
PGProcter & Gamble CoClick here to get a quote!
TRVTravelers Companies IncClick here to get a quote!
UNHUnitedHealth Group IncClick here to get a quote!
UTXUnited Technologies CorpClick here to get a quote!
VVisa IncClick here to get a quote!
VZVerizon Communications IncClick here to get a quote!
WBAWalgreens-Boots AllianceClick here to get a quote!
WMTWal Mart Stores IncClick here to get a quote!
XOMExxon Mobil CorpClick here to get a quote!

Pop Quiz!

[qsm quiz=15]

Businesses keep financial records so they will know how their company is performing financially.  For publicly traded companies (ones you can purchase stock in), these records are also shared with investors. The three main financial statements companies use are the Income Statement, the Balance Sheet, and the Cash Flow Statement.

The balance sheet provides an overview of the value of a company at a specific point in time.  It includes a summary of the company’s assets (what they own), liabilities (what they owe), and the owner’s or shareholder’s equity (the amount of money invested by the owner in the business minus any money taken out by the owner). If the company is privately owned, the term “owner’s equity” will be used.  If the company is publicly traded, then the term “shareholder’s equity” will be used.  Equity represents the value of the company and is calculated by subtracting liabilities from assets.

The balance sheet is sometimes called the “Statement of Financial Position” because it shows a snapshot of the company’s financial condition at a single point in time.  This report uses a simple calculation to determine the financial condition.  The calculation is called the accounting equation.

The Accounting Equation

What we own What we owe What we’re worth
AssetsLiabilities=Owner’s Equity

What are the Components of a Balance Sheet?

A standard balance sheet has two sides.  The assets are listed on the left side, and the financing is listed on the right.  The financing includes liabilities and ownership equity.   Assets are listed in order of liquidity.  Liquidity means how easy it is to convert the asset into cash.  Assets are also broken down into current assets (any asset which is expected to be sold or used within the year) and fixed or non-current assets (a company’s long-term investments and assets that are expected to last many years and can’t be easily converted into cash). 

Current AssetsFixed Assets
CashLand and building
Accounts receivablePlant and equipment
Short-term investmentsFurniture
InventoryComputers
 Vehicles

Liabilities are listed on the right side of the balance sheet.  They are listed in order of when they are due — shortest term to longest term.  Liabilities are broken down into current liabilities (debts that must be paid within one year) and long-term liabilities (debts that will be paid over a longer period of time).

Current LiabilitiesLong-term Liabilities
Accounts payableBonds payable
Notes payableLong-term notes payable
Wages payableDeferred tax liabilities
Income taxes payableMortgage payable
Interest payable 

Why is it called a Balance Sheet?

Remember the accounting equation:  Assets – Liabilities = Owners Equity?  Another way to look at the equation is that Total Assets = Liabilities + Owner’s Equity.  When you look at the equation this way, it tells you how your assets were financed.  Did you have to borrow money (liabilities) or did the owners use their own money (owner’s equity)?  After entering your numbers on both sides of the balance sheet, the left and right sides should be equal.  They should balance. 

Example of the balance sheet from the City of Toledo, Ohio in 2016-2017

Who is interested in the Balance Sheet?

There are many players who are interested in the Balance Sheet:

  • Investors:  Current and future investors will review the Balance Sheet to view the company’s financial position. The numbers can be used to evaluate a company’s solvency (the company’s ability to pay its overall debt), liquidity (the amount of liquid assets that are available to pay expenses and debts as they become due) and capital structure (the particular combination of debt and equity used by a company to finance its overall operations and growth). 
    • Lenders/Creditors:  If a company is seeking more funding, lenders and creditors will use the Balance Sheet to determine the company’s ability to pay their current obligations before they decided whether or not to grant another loan.
    • Management:  Managers use the Balance Sheet to keep track of the company’s changing financial position in order to make strategic decisions for growth and to prevent bankruptcy.

Example Balance Sheet for Apple Inc.

BalanceSheetExample

Companies often compare Balance Sheets from one period to the next (as shown above) in order to compare side-by-side what is happening to each of the components listed. Are their current assets growing?  Are liabilities decreasing? Have they accumulated more debt?  Understanding this basic financial statement helps company management set goals and make decisions for the coming year.

Where can I find the Balance Sheet for a specific company?

You can find the balance sheets of every publicly traded company in the United States using the Research tool.

Just open the Research page, and click “Financial Statements” on the left side of the page. You can review the Balance Sheet, Income Statement, and Cash Flow Statement for every publicly-traded company in the United States, going back 5 years.

Pop Quiz!

[qsm quiz=21]

Businesses keep financial records so they will know how their company is performing financially.  For publicly traded companies (ones you can purchase stock in), these records are also shared with investors. The three main financial statements companies use are the Income Statement, the Balance Sheet, and the Cash Flow Statement.

The income statement primarily focuses on the company’s revenue and expenses (what they’ve earned and what they’ve paid for) during a particular period of time.  The bottom line shows a net profit or a net loss depending on the company’s performance during that time period.  Companies may complete an income statement whenever they want, but typically they are completed quarterly (every three months) or annually. 

Explanation of an Income Statement

Income statements are known by various names including a Profit and Loss Statement and an Earnings Statement.  This is because the income statement shows whether or not the company is making a profit.  The income statement serves two main purposes: 1) It shows managers how the business is performing and whether or not sales are keeping up with expenses, and 2) It provides investors with a snapshot of the overall performance of the company. The important thing to remember about an income statement is that it represents profit for a particular period of time (e.g. 1st Quarter 2020). This contrasts with the balance sheet, which represents a single moment in time (e.g. September 2019).

Apple, Inc’s Income Statement

The portion of the income statement that deals with operating items is interesting to investors and analysts alike because this section discloses information about expenses that are a direct result of the regular business operations. In the example provided, you see that this includes advertising expenses, sales commissions, and office supplies and equipment needed for the business to operate.

The portion that deals with non-operating items discloses revenue and expense information about activities that are not tied directly to a company’s regular operations. In the example provided, you see that this includes interest revenue, interest expenses, and loss from a lawsuit. 

Steps in Understanding the Income Statement

In order to best understand how to read and understand an Income Statement Sheet, it’s important to understand the order of which information is displayed.

  1. Date: The date that the statement was created is always at the top.  It reflects all data for a particular period of time such as “For the period of January to March 20xx.”
  2. Net Sales or Operating Revenue: This represents the total amount of revenue earned from customers purchasing the company’s goods or services.
  3. Cost of Sales (also known as Cost of Goods Sold, or Cost of Revenue): This is the amount of money the company has spent in the production of its goods. It would include costs for raw materials, labor, and manufacturing/
  4. Gross Profit or Margin: This represents the profit a company has earned only after taking into account the Cost of Goods Sold (#3).  The number is calculated by subtracting Cost of Goods Sold from Net Sales.
  5. Operating Expenses: This figure represents the costs that the company pays for running the business.  If a cost is not directly related to producing the good or service, it is included here. 
  6. Operating Income: This figure represents earnings from normal operations without taking in to consideration taxes and special one-time occurring items (e.g.: settlement of a court case).  It is calculated by subtracting Operating Expenses from Gross Profit.
  7. Interest Expense: This figure reflects the cost of borrowing money.
  8. Pre-tax Income: This figure represents total earnings before being taxed.  
  9. Income Taxes: This figure best represents what taxes the company expects to pay during the time period specified.  It is usually an estimate since taxes are normally paid once a year but Income Statements are prepared four times a year.
  10. Special or Extraordinary Expenses: This figure represents special expenses the company had to pay during this period of time that were not part of the daily operations, such as purchasing a warehouse or a large piece of machinery
  11. Net Income: This figure represents the profit (or loss) the business earned after subtracting all expenses and taxes. 

Main Points to Remember

  • The Income Statement represents how well a company is doing financially during a period of time. It summarizes the revenue, expenses, and profit into one easy-to-read financial document.
  • Investors pay close attention to an Income Statement because it is an accurate snapshot of a company’s performance over a specific period of time.
  • Lenders evaluate the suitability of a loan based on the Income Statement because it shows the profit a company is making.
  • Investors pay close attention to the “bottom line” and expect this figure to grow consistently over time. The “bottom line” figure is often the first data point an investor looks at when determining whether or not to invest. 
  • Comparing Income Statements from one period to the next is a great indication of the direction a company is heading.  If Net Income is increasing, then the company is heading in the right direction.  If it is decreasing, then the company needs to make some changes.

Finding Income Statements

You can find the income statements of every publicly traded company in the United States using the Research tool.

Just open the Research page, and click “Financial Statements” on the left side of the page. You can review the Balance Sheet, Income Statement, and Cash Flow Statement for every publicly-traded company in the United States, going back 5 years.

Pop Quiz!

[qsm quiz=20]

ETFs have been one of the most popular investment vehicles in the world over the last decade or so, with investors of all types attracted to the low fees, but diverse holdings, falling somewhere between mutual funds and stocks in terms of how easy they are to manage in a portfolio.

However, one of the ETF’s biggest strong points, that you can trade it throughout the day like a stock instead of just end-of-day like mutual funds, does come with a bit of an Achilles heel, as many investors found during the extremely volatile trading in August.

With mutual funds, the value of your shares is only calculated at the end of the day, when the portfolio manager re-values all shares based on the underlying holdings. It is a fairly simple procedure (taking the end-of-day values of all the fund holdings), but it means that the fund’s shares cannot trade throughout the day, since the individual investors do not know precisely what their shares are worth until this calculation happens.

With an ETF, the value of the underlying assets changes throughout the day, but since the fund is not actively managed (meaning what your shares actually represent) doesn’t change during the day, you can know the value of its underlying assets at any time. However, ETFs have their own bid and ask based on the supply and demand of the ETF shares themselves as well; this means that during a “panic sale”, the shares of the ETF can fall much more quickly than its underlying assets. This was particularly the case with a Blackrock ETF called iShares Select Dividend ETF (DVY), which fell by over 30% during a very short panic, while its underlying assets only fell by about 3%.

While this makes an opportunity for arbitrage, it also means that investors buying an ETF to take advantage of its holdings can get hit by some very big shocks that are not part of what they originally thought they were buying; if you held DVY during that time it crashed and had a stop order in place, you would have sold out of your position at a huge loss, when the underlying assets that you thought your value was based on really did not drop by very much.

Investors are watching how ETF companies manage these kinds of issues, if this is not addressed, it could be a huge risk that investors do not particularly want to take!

Technical Analysis

Fibonacci Arcs and retracements are used as a technical indicator to determine support and resistance. As with most indicators it can be used to see if a breakout has occurred or if a reversal is likely to happen.

Fibonacci Number

To understand the Fibonacci arcs and retracements, we must first understand where the Fibonacci numbers comes from. The Fibonacci numbers are found by starting with 1,1.  The next number in the sequence is found by adding the previous two numbers. To see it in action, consider this sequence of Fibonacci Numbers:

1,1,2,3,5,8,13,21,34,55,89,144,233,377,610,987,1597

To get them, we go like this:

  • 1 = 2
  • 1= 3
  • 2 + 3 = 5
  • 3 + 5 = 8
  • 5 + 8 = 13
  • 8 + 13 = 21
  • 13 + 21 = 34
  • 21 + 34 = 55
  • 34 + 55 = 89
  • 55 + 89 = 144
  • 89 + 144 = 233
  • 144 + 233 = 377
  • 233 + 377 = 610
  • 377 + 610 = 987
  • 610 + 987 = 1597

We can use these numbers to determine ratios. As the numbers in the sequence get larger, the ratio between them converges to a constant. These ratios for the basis for the Fibonacci arcs and retracements.

By dividing a number by the number after it (ex:610/987) we will get 0.618.
By dividing the number by two after it (ex:610/1957) you get 0.382.
By dividing a number by the number before it we get 1.618.
Note:Other numbers can also be found by varying the numbers we use in the sequence.

These numbers are extremely important not just in finance, but in nature as well and can be seen nearly everywhere. (1.618 and 0.618 is termed the “Golden Ratio” because 1/1.618 = 0.618 among other things). In statistics, the percentage of a sample population found in a normal distribution in within half a standard deviation is 38.2% (which is what you get when you divide a Fibonacci number by two before it). The sheer amount of times we see these numbers in nature and elsewhere is enough to give some credit as to the use of the Fibonacci sequence.

Fibonacci Retracement

This tool, though less useful than the Fibonacci arc, can be used to determine likely support and resistance levels and can help with past chart patterns as well.
Drawing lines at the high a low, and at 38.2% 50% and 61.8% will provide important support and resistance.

As we can see below, though useful, the retracement only provides so much information and is generally less useful than drawing your own support and resistance lines.

fibretracement

What’s important here is that you can see is on the way down the stock went through three lines very quickly but stayed in the top and bottom tiers for quite a long time.

Fibonacci Arc

Fibonacci Arcs are far more useful as they take into account the time as well as the price.

fibarc

From this graph we can see that the arc follows the 61.8% line very closely before it cuts into the next percentage area. This is very predictable since it couldn’t possibly continue to rise at the rate it was and was a support arc for that period. As with most technical indicators, Fibonacci Arcs and retracements are a tool among many others. They may provide lots of information in one graph and very little in another. What’s important to note is that it would very unlikely for the trades to go from the 100% arc to the 50% arc without some time passing by.

Forex

Definition

Forex or (FX) is the term used for the world’s currency market. It comes from the words “Foreign Exchange”. Unlike stock exchanges like the New York Stock Exchange (NYSE), there is no physical location for the Forex market, instead it describes the “inter bank” or Over-the-counter (OTC) market for currencies. Currencies trade 24 hours a day, five days a week (Sunday night to Friday night). Forex trading is the largest market in the world, but also has the most volatility.

Currencies are always traded in pairs; you must trade one currency vs another. For example, if we bought USD/EUR for 1.2 it would mean you need 1.2 US dollars for 1 Euro. Similarly the EUR/USD would be the inverse of that, or 1 over 1.2, meaning that to buy 1 USD you would need 0.8333 Euro.

Leverage

Forex trading is considered very risky because most Forex trading is done with 20, 50 or even 100 times margin meaning that you are exposed to a very large amount of leverage. This means that for every dollar you put down of your own money to open a position, you are borrowing another $19, $49, or $99 from your Forex brokerage.

Brokerages will loan you this money because you are trading currencies, so the value is inherent, and all of the risk is passed on to you. For example, if you have a 50 times leveraged account, if the exchange rate falls by 1%, you can lose 50% of your initial investment! You can also have the opposite case with a winning trade, but the number one priority of all investors is capital preservation; maintaining and growing the money you invest. By exposing yourself to such a high loss, you can walk away losing almost everything very quickly.

Most professional investors use an 8x or lower margin, higher amounts are usually used by beginners with very small accounts or people with many positions and want to utilize the risk of loss for the rewards.

How To Practice Trading Currencies For Free

Trading currencies takes lots of practice to get it right! There are a few ways to practice for free:

Definition

A Stop (or stop loss) order and limit order are orders that try to execute (meaning become a market order) when a certain price threshold is reached. Limit and stop orders are mirrors of each other; they have the same mechanics, but have opposite triggers.

When creating a limit or stop order, you will select a ticker symbol and quantity, just like a market order, but you will also select your “Target Price” as well. The target price is the price that triggers the limit or stop. Setting a target price does not guarantee you will get that price, it just means a market order will be created at that time. If there is not enough volume in the market to fill your order, it still may not execute.

Limit

A limit order will set the maximum price I am willing to buy(cover) at or the minimum price I am wiling to sell(short) at.

Example

Let’s say Verizon (VZ) is at $50, but you think it is overpriced and want to buy it once it falls. By setting a limit order at a target price of $45 we can wait until the price reaches that without having to sit in front of a screen. As long as the price is greater than $45 it will not execute. As soon as the price drops to $44, your stop order becomes a market order, filling at $44.

Here is a chart showing how a “Limit Buy” order works, showing a sample stock’s price over the course of a day:

limit order

Stop

A stop order will set the minimum price I am willing to sell, or short a stock. It can also mean the maximum price at which I am willing to buy, or cover.

Example


Let’s say you own PayPal stock (PYPL) that you bought at $25. If the current price is $31, you want to keep holding the stock in case the value continues to rise, but you do want to protect the gains you made.

You can put a “Stop Sell” order with a target price of $30, so if the price of the stock falls to $30, you will be protected from any more losses. If the value continues to rise, you will continue to hold the stock.

The table below can be an easy reminder of when a stop or limit order will execute.

limitstoptable

Uses

Stop and limit orders will help you protect you from loss, or help you take advantage of a gain, as well as give you access to more advanced trading strategies.

One of the greatest advantages of stop and limit orders is that they can be set and left with Good Til Cancel (GTC) order expiration, and thus you don’t have to watch the stock price constantly to get well-timed trades. If prices change past your limits, the orders will execute automatically, giving you less to worry about.

This also means that you can build a much wider portfolio. If you do not need to constantly watch the price of every single one of your holdings and watchlist items because you have already set up limit and stop orders based on your preferences, you can have a much larger range of symbols on your “radar”.

Another important use is that you can take some of the emotion out of your trading. By setting limits and stop orders beforehand, you don’t have to “panic sell” or “panic buy” to take advantage of price swings; you already will have standing orders ready to spring into action when your pre-determined criteria are reached.

Definition

An order type that allows to set a moving stop or limit target price. The target price moves based on the daily high. Trailing stops can be set either in percentage or in dollars and cents terms. When in dollar terms it will activate when the price has moved by the target you have set relative to the day’s high.

Example

Let’s say we bought a stock for $30. The stock then climbs to $35. We don’t think it will go much higher but we do not want to lose our profit either. We could then set a trailing stop order for $3. This will act just like a normal stop order. Selling at your target price. Here, however, your target (moving) price is $3 and when the price is $35 it will trigger at just below $32. As we will see though, it changes based on the high:

trailing stop

We’ve set our trailing stop at the second bubble. Currently our selling point is $32. The price then goes up to $37. The new stop order will occur at 34$ (shown by the lower red dotted line). However, the price continues to go up to $39.50 making our stop target price $36.50 The price moves down and then back up to $38 but this will not affect your trailing stop since it is not higher than the previous high. Thus our stop target is still $36.50 which will be activated at which point we fall just below it.

Similarly, we could have use a percentage trailing stop. This will act just as it did previously but the target will change based on the high price. Hence if we used a 10% trailing stop in the example above. Our exit would have been at 39.50 – 10% * 39.50 = $35.55. Percentage trailing stops can be very useful to help protect you if your price has increased considerably. For example, a $1 trailing stop might be fine at $10 but wouldn’t be if your stock had increased to 100$. You would be sold out of your position far too early.

Note: There are many variations that can be made with trailing stops with advanced trading software. You can change the high’s and the duration by tick size or have different ways of calculating the target price. This is far more complex however and requires a very experienced trader.

Bonds are essentially a much more formal I.O.U (I owe you) used to borrow money. You buy the bond in return to interest over a given period of time. When a corporation or government needs money they issue bonds that people buy. In turn, the issuer (the person who sells the bond) takes the money. However, no one would buy something if they didn’t get something in return, so the issuer will offer to not only pay the person back at a specified date but also provide some interest along the way.

There are two major types of bonds:

Government Bonds

These bonds are issued by governments who want to raise cash. It can be raised by any level of government; large cities often issue bonds to fund public projects, while national governments issue bonds to fund the government. When you hear about the National Debt of a country, it usually means the amount of bonds it has currently issued.

Government bonds can be traded by normal investors, but they can also be bought and sold between countries (if you hear a news pundit mention that the US government owes money to another country, like China, it is almost always because that country purchased a very large number of government bonds), or even between different parts of the government.

In the United States, the Federal Reserve buys and sells bonds from the US treasury bonds in order to influence the prevailing interest rates, for example.

Corporate Bonds

Corporations can also sell bonds, which is essentially borrowing money from a large pool of investors. Smaller companies can usually just take loans out from a bank, but if the company is very large (like Apple (AAPL), they use more cash than banks can usually give out in one single loan. Instead, they will issue bonds to investors, with a promise to pay back at a certain date with interest.

Bonds are one of two ways that companies frequently use to raise extra cash that they use for investment and expansion; the other is by issuing stocks. However, there are very important differences between the two:

  • If you buy a bond, you are lending money to a company and they are promising to pay you back later with interest
  • If you buy a stock, you are buying a part of that company and are entitled to part of its profits (in the form of dividends).
  • The value of the bond comes from how much you lent the company and the interest rate they will pay you back
  • The value of a stock comes from how much the company itself is worth (including all its assets and businesses)
  • Bonds expire; at the expiration date you receive back the amount you lent
  • Stocks do not expire

Details:

Bonds can be bought and sold just like stocks, or they can be bought once and held to maturity at which point they will expire and return the face value. Essentially, when you buy a bond and hold it to maturity you will receive a certain predetermined interest rate (or coupon).

Remember that while a bond represents an amount of money that you lent to a government or company, they can still be bought or sold between investors like stocks. This means that you can buy a bond from Google (GOOG), but then later sell it to another investor who will then continue to collect the interest and receive the amount you initially lent Google when you bought the bond. Similarly, you can buy bonds from other investors rather than buying them directly from the company that issued them.

Investors typically will buy bonds when they are very “Risk Averse,” meaning they would rather have the guaranteed payment of regular interest than make “riskier” investments like stocks, whose value can rise and fall a lot over time.

Test Your Knowledge

See if you can match the attributes below to either “stocks” or “bonds”. Drag each of the attributes into the correct box, and click “check” to see if you got them all!

Here a few terms that are important when looking at bonds:

Face Value

The face value, also known as par value or principal is the amount of money you will receive when the bond matures. This is almost always $1000 but there can be exceptions.

Coupon

This is the amount of interest you receive on your bond every year. It is usually stated in terms of the coupon rate (in percent). You then multiply your coupon rate by your face value, which in most cases will be $1000, to get your coupon. For example, if a bond is quoted at 4.00% you will receive $40 every year. Bonds can also be paid multiple times per year and are usually semi-annual (twice a year). In this case your coupon rate stays the same at 4.00% but you would receive two coupons of $20 instead of one coupon of $40.

Maturity

The maturity date is when the bond expires. If you are holding the bond on the maturity date then the bond Issuer will pay you the face value of the bond, which is almost always different from what you initially paid for it. In addition to the face value of the bond, if your bond had a coupon then you will also receive one final payment of whatever interest has accrued since the last payment was made. After this point the bond issuer’s debt to the bond holder is considered to be settled.

Yield

Since bonds are bought and sold between investors just like stocks, the value that they are bought and sold for on the market may not be exactly the same as the interest payments left until the bond expires and the face value. This is a very difficult concept to understand for many investors but is essentially the return you obtain when factoring the price you paid for your bond. The bond’s price is affected by the risk free rate and the bond’s own rate, as well as many other factors. The higher the Yield, the better the bond looks compared against other investments.

Accrued Interest

The interest payments on bonds are not paid daily; they are usually paid out once or twice a year (depending on the bond). However, the bond issuer owes whoever holds the bond interest for as long as they held it; if you only own a bond for a day, you are still entitled to one day of interest.

This is important for investors who buy and sell bonds a lot; if you own a bond that pays interest once per year on July 1st, but you sell it to someone else on June 15, you are entitled to most of the interest payment that they will receive from the bond issuer on July 1.

For example, lets say John bought a 5% 10 year semi-annual bond on the day it was issued and waits one year and 2 months before selling it to Kelly. This means John received two $25 coupons in the first year, and is entitled to another $8.33 from the bond issuer on top of the price he sold the bond for. This is because he held it for another two months hence 2/6 * $25 = $8.33.

Accrued Interest with Pricing

When looking at Accrued Interest, it has a huge impact on bond’s prices. Investors look at this in terms of a bonds “Dirty Price” and “Clean Price”. The Dirty Price is the price the bond trades for on the markets (if, for example, you bought a bond from another investor). This price does not subtract the accrued interest from the bond’s value. The Clean Price is the price with that accrued interest factored out.

Dirty Price = Clean Price + Accrued Interest

When you get a quote for a bond, you are almost always quoted the “Clean Price”, but when you buy it you will always pay the “Dirty Price”.

Rating

A rating is given to bonds to determine their level of riskiness. They are generally performed by third party auditing firms such as Standard and Poors, Moody’s or Fitch. Ratings system differ from company to company but it is important to know the difference between different bond ratings. The most common bond ratings are as follows:

AAA: Strongest Quality Rating, this has a very very low risk of default.
AA+ to AA-:Very high quality investment Grade.
A+ to BBB-:Medium quality investment grade.
BB+ to BB-: Low quality (non-investment grade) “junk bonds”, high risk of default.
CCC+ to C: Speculative bonds with very high risk of default.
D: Bonds in default for not paying principal and/or interest.

Portfolio

Nearly every balanced portfolio should have a place for bonds, if only for their strong safety while still beating inflation. Bonds can also be very risky, such as junk bonds (bonds issued by governments or companies that are very likely to not be able to pay back), that may pay high coupon rates but have a high risk of default. There are also many different types of bonds as well, such as convertible bonds that can be turned into stocks or inflation protected bonds that simply follow the rate of inflation.

Bond ETFs

You can also get exposure to bonds through bond ETF’s such as BND or LQD. They have some notable differences between bonds with regards to tax considerations and returns but are much easier to trade.

Trading Bonds

If they are allowed in your contest, you can use the Bonds Trading Page.

Notes for trading bonds:

  1. All bonds, corporate and treasury, that we support are in one master list. We only have US bonds (Click Here for a master list)
  2. You cannot short bonds
  3. You can only use market orders
  4. We do pay out interest and expire bonds (and pay back the coupon)
  5. There are no volume limit rules on Bonds

Pop Quiz

[qsm quiz=103]

Definition

Your “Risk Level” is how much risk you are willing to accept to get a certain level of reward; riskier stocks are both the ones that can lose the most or gain the most over time.

Risk

Understanding the level of risk you need and want is a very important part of selecting a good strategy. For nearly any strategy, whether it is picking stocks or doing asset allocation (picking how much of each type of investment we want) the steps in determining your level of risk are generally very similar. Determining the level of risk and reward needed is a key aspect of determining an investment strategy.

Determining your risk level

    • Time horizon: Your time horizon will involve when you expect to use the money you are investing.For example, a 25 year old who is saving for retirement can go for much riskier investments since if he loses his money in a bear market, he still has a few decades to be able to make his money back. Choosing safe investments for a 25 year old would also not be a good idea since he would be losing out on the opportunity to make a lot more money. On the other hand, someone who is retiring next year will not want to risk losing his or her money if a market collapse occurs right when they retire. They would have no time to recuperate the money and could be in serious trouble, so they will want very low risk investments.Hence, the longer your time horizon, the higher risk you can afford. The shorter the time horizon the lower risk you should choose.
    • liquidity: This aspect is very similar to the time horizon. Essentially someone would not choose an illiquid asset if they had needed the money for that investment in the next month. For example, real estate is considered fairly illiquid as it can take months to years to get a good price on your investment. On the other hand, popular stocks are considered very liquid as they can usually be sold anytime during market hours.
    • Investment knowledge: The higher your investment knowledge, the riskier the investments you can take. The reason being that you are more aware of the inherit risks and therefore more likely to make informed decisions. You would not expect someone with no investment knowledge to jump right into currency trading, they would most likely start off with mutual funds or bonds.For example, a wall street trader will not consider futures to be as risky as someone who has never even traded a stock. The trader will know how to protect himself and have a better idea of the risks involved. It is essentially the old adage “That knowledge is Power” at work, but in this case, Knowledge is Reduced Risk.
    • Risk aversion: This is a measure of how comfortable you are with risk. The opposite of risk aversion is risk seeking. The level of risk aversion is usually determined by considering different scenarios and picking the one that one feels most comfortable with.

      High risk aversion: You would prefer to invest in a stock that could have gains of 20% but has only lost 5% at most at a time.
      Moderate risk aversion: You would prefer to invest in a stock that could have gains of 70% but also loses 20% on a regular basis.Low risk aversion (risk seeking): You would prefer to invest in a stock that could have gains of 200% but also loses 100% on a regular basis.
    • Economic outlook: Unless you are following a very specific contrarian strategy, the worst the economic outlook is, the lower we would want our risk. On the other hand, a great economic outlook would allow us to increase our risk.


    • Savings and income: This can have a large bearing on the type of investments you will make. Someone with large amounts of savings but very little income will invest very differently from someone with a lot of income and very little savings. Again, this comes down to your individual goals. In general we would establish with our time horizon whether what our objective is. Whether we are trying to save or have income every year.


  • Tax Considerations: Tax considerations are a very complex matter given the large amount of differences in taxes between countries and even within. Tax breaks and savings should not be your main focus at the detriment of picking sound investments. However, it is very important to take advantage of tax breaks whenever possible when investing. Furthermore, there are usually differences between capital gains (for example a growth stock) and dividend gains (dividend stocks) which can make one or the other far more or less attractive than the other. Every location is different so it is important to educate yourself on the taxes associated with each asset.

To summarize, if investor XYZ wanted to know what his level of risk should be for his Investment strategy, he would go through each category and sum up his risk. For example, if XYZ needed his money in ten years, has moderate risk aversion, has very little investment knowledge and there is poor economic outlook. We could say his risk should be somewhere in between low and moderate.

The risk pyramid

Now that you’ve got a better idea of your risk level we can look at the types of investments that are right for that level of risk.

riskpyramid

Note: You can mix a high risk asset with a low risk asset to get a similar asset of moderate risk. However, this is not always the case and is often difficult to assess exactly the level of risk, especially for high risk assets. It’s therefore much better to get a moderate risk asset if you want a moderate risk. If you are looking at this in the context of a portfolio you should also look at Asset Allocation.

Creating a Diversified Asset Allocated Portfolio

Here are a few guidelines when trying to create your portfolio:

  • Cash: Keep enough cash on hand for daily purchases and small emergencies. It can be wise to keep enough money in your bank account to avoid the fees.
  • Gold: Many investors keep a small amount of physical gold and cash on hand. This can be useful in financial crises like the great depression where limits are imposed on the amount of money that can be withdrawn. Gold is also extremely safe and not tied to a countries currency.
  • Property: Your house is an investment as it has value and should be considered as such.
  • Bonds: They are generally not good investments unless you are trying to protect what you already have. This was not always true however and is dependent on the interest rates.
  • Stocks: Diversification of stocks is important and generally the cheapest way to do is with mutual funds or exchange traded funds (ETF). Growth Stocks are generally considered to be riskier than income stocks.

Examples

Here are examples of asset classes we might assign to each investor. Note: Asset allocation is not an exact science and can have big differences between one opinion and the next.

Low Risk Portfolio: Retiree with high investment knowledge, very low income and moderate risk aversion.
Moderate Risk Portfolio: Middle aged investor with low income, high investment knowledge and moderate risk aversion with large savings.
High Risk Portfolio: Young investor with good income and high investment knowledge and low risk aversion and high spending with no owned property.

assetallocation

Definition:

An asset is anything that has monetary value and can be sold. Assets can be anything from a pencil (though it is not worth much) to a skyscraper to things like Stocks and ETFs.

There can also be intangible assets such as the value of a brand name or logo.

Details:

Assets generally refer to either something that you intend to sell later for a profit, or something you are actively using to make money. This means that assets generally fall into two categories, Investments and Capital. The easiest way to tell them apart is this:

  • If you are using it to build something or make something (like a computer or a factory machine) that you later sell, it would be capital
  • If the value of the asset is the asset itself (like stock, bonds, or gold), it would be an investment

There are also some things that fall in the middle: For example, your house is considered an “investment” even though you are using it to live in, because hopefully it can one day be sold for a profit, with that profit being likely used for retirement.

Examples:

Here is a short list of typical assets:

Cash: Cash, marketable securities, coins.
Precious Metals: Gold, silver, platinum.
Investments: Stocks, bonds, options, pensions, mutual funds.
Property: Land, commercial buildings, houses.
Machinery: Factory machines, cars, trucks, forklifts, washing machines.
Intangible assets: Trademarks, brand value.
Objects: Inventory, books, anything that has value.

Note: Typically when asset is mentioned in a financial context, it usually refers to real estate, precious metals, investments such as stocks and bonds, cash and other financial devices.

There are also many more types of asset than this

Definition

“Asset Allocation” is how you have divided up your investments across different assets. You can have all your assets in one place, or you can use diversification to spread them around to reduce risk.

Details

Whenever you pick stocks, open a bank account, get paid, buy something, or do anything with any resources, you are doing some form of “Asset Allocation”. Early on, the choice is simply “Spend” or “Save”, how you are using your money. But like most things with investment, it is never that simple.

For example, once you have chosen to “spend” or “save” a dollar, you have another choice to make:

  • If I spend it, do I buy a video game or go out to the movies?
  • If I save, do I put it in a savings account or hold it as cash?

For us, we care mostly about savings. So if you save $1000, you can save it as cash, put it in a savings account, or invest it.

  • If you put it in a savings account, there are different kinds of savings accounts that may give you a higher interest rate, but limit how much you can withdraw.
  • If you invest it, you can divide your investment between stocks, bonds, mutual funds, or ETFs
    • If you invest in any stock, bond, mutual fund, or ETF, you will need to decide which specific ones to invest in

Of course, at every level you also have a choice of splitting your money and doing one thing with part, and something else with another. With your $1000, you can spend $300, hold $100 as cash, put $200 in a savings account, use $150 to buy Johnson and Johnson (JNJ) stocks, and invest the last $250 in mutual funds. That is a lot of choices to make, even with one small block of assets!

Choosing How To Allocate Your Assets

Every time you allocate your assets, you are making many choices at once

When Spending

When you spend your assets, your main decision is Opportunity Cost. If you spend your money on one thing, you cannot spend it on another, so you need to make sure you are buying whatever it is that will give you the most benefit. You are also choosing not to save or invest, which means the benefit you get from buying something today should outweigh the benefit of having that extra investment return in the future.

When Investing

When you invest, your asset allocation will be based on 4 main criteria:

  1. Risk: Sometimes taking bigger risks can give bigger rewards, but you still have the chance of losing big too. How much risk you can tolerate will dictate a lot of your asset allocation.
  2. Liquidity: How much do you want the freedom to move your money? Assets that you can quickly convert back to cash are said to be very “liquid”, while assets that are very difficult to convert to cash (like houses) are “illiquid”. How much you value being able to move your asset allocation over time will also dictate what kinds of things you invest in
  3. How much you have: You can only buy a house if you have the ability to pay for it, and that goes with most other investments as well. If you do not have the assets necessary for a minimum investment, some options may be not open to you. This is becoming less and less of an issue with stocks, bonds, mutual funds, and ETFs, however.
  4. Opportunity Cost: This is the same as with Spending; whatever you invest in one asset is money you cannot use to buy something or invest in something else.

When you balance these four criteria, you will start coming up with your asset allocation. Just because you value one more than the others does not mean all your assets will go to one place either; a person who values liquidity the most probably will not keep all their assets as cash, both because it is risky (cash can be easily lost or stolen), but also because there is only so much cash you need at one time, so you can hold lots of cash but still keep some invested.

Asset allocation is the basis for risk management, building a portfolio, and diversification

An investment strategy is the set of rules and behaviors that you can adopt to reach your financial and investing goals. Choosing an investing strategy can be a daunting task when you are starting to learn about investments and finance. Here we will look at the larger overall strategies rather than very specific strategies.

Given that this is such a broad term there can be strategies that go from the top (Overall Portfolio Strategies) to the bottom (stock-picking strategies). You can decide on a strategy starting with an overall strategy and then select more specific strategies (top – down approach) or similarly you can look at a specific strategy and select the overall strategy that goes with (bottom – up approach).

What’s important to note is that a strategy can incorporate multiple strategies, practices and tools. Doing one strategy does not always mean that another strategy cannot be used in conjunction. What’s most important is finding your own strategy and familiarizing yourself with all the different strategies and financial tools that are available so that you can make a decision that is well suited for you.

Picking a Strategy

Strategies

Given the huge number of strategies and variations within strategies we are only going to review common strategies. The level of risk for most is highly dependent on the type of investments made, rather than the strategy itself. The most popular strategy that is used by most investors that would go to a bank or an investment firm, for example, is a mix of diversification and asset allocation.

  • Random picks

Picking a large amount of random stocks has been found, on average, to be more successful than the vast majority of trading strategies.

  • Follow

Involves following whatever stock is “hot” at the time.

  • Buy and hold

Involves simply buying stocks and holding them for a longer period of time.

  • Day trading

Considered to be fairly risky trading strategy of buy and selling many times in one day to take advantage of fluctuations in the market.

  • Contrarian

Involves doing the opposite of the current market sentiment. Buying when everyone is selling and selling when everyone is buying.

  • Cyclic

Involves trying to time market ups and downs and trading accordingly, usually done with technical analysis.

  • Technical

Using Technical analysis to make decisions.

  • Fundamental

Using Fundamental analysis to make decisions.

  • Income

Finding assets that give income on a regular basis (such as dividends)

  • Growth

Finding assets that will have high potential growth but little current income.

  • Diversification

Choosing a large number of stocks or assets to reduce risk.

  • Asset Allocation

More of a guideline than a strategy, that can help with determining the correct amount of investment in each asset type.

As we’ve seen, even a buy and hold strategy can be incredibly complex depending on the specific strategy you use and the level of analysis made. What’s important is to tailor your strategy with what you are trying to accomplish. Someone who needs money right away but is risk seeking and has a great deal of knowledge may consider day trading to be a very viable option. Similarly, someone who has decades to invest and moderate risk aversion may still want to try his hand at day trading.

Passive Vs Active

Overall Strategies can also be broken up into passive and active categories:

Passive strategies are just that, passive. After making the initial decision to purchase a stock, investment, etc. the passive investor will keep it for months or years without making large changes. An example of this is someone like warren buffet who generally holds stocks for long periods of times and does not make changes to his holdings very often.

The active trader, however, will trade multiple times a week or even per day and will constantly evaluate what he is doing. Day traders are the most obvious example of an active trader.

It’s important to note that passive and active trading is over a spectrum, so someone who makes a few adjustments to their portfolio a few times a week could still be considered passive depending on the size of his portfolio for example.

Definition

Volume-Weighted Average Price (VWAP) is often used as a trading benchmark by traders, pension funds, mutual funds and market makers. It can allow traders to get a sense of how successful they were in obtaining a good price. A buy order filled below the VWAP would be considered a good trade.

Using VWAP

A lot of people will wonder why not just use the average price, it’s a lot easier to calculate and isn’t it essentially the same thing anyway? As we can see, the difference is that it tracks volume as well. By tracking volume you also get information about liquidity as well as the amount of money that traded, not just the price.

Calculation

VWAP calculation can vary greatly depending on the time frame and time horizon you choose, as well as the price calculation. However, VWAP is typically used within one trading day and uses a one minute time frame.

The formula for VWAP is:

VWAPformula

The price can be used as the last price in a time frame or the price calculated using the high, low and close in a given time frame. Here is an example of the calculations:

VolumePricePrice * VolTimeVWAP 1 min
2010.1510.15*20 = 2039:30203/20=10.150
3010.2110.21*30 = 306.39:31(203+306.3)/(20+30)=10.186
7510.2275*10.22 = 766.59:32(203+306.3+766.5)/(20+30+75)=10.206

We can see from the calculations that the VWAP is cumulative and thus a price at the beginning with high volume will have more effect than a price at the end of the day, since it is now just a drop in all the trades placed over the day. It would take a very large volume and/or price change to change the VWAP at the end of the day (depending on the time frame you use). Another important thing to notice is the time frame, a smaller time frame (such as every trade or tick) will be more accurate, but for a stock that trades a lot this could be data for 50,000 trades. If you are doing multiple stocks, this could easily slow down or even crash your computer if you started storing and calculating enough days.

Graph

The greatest change in the results and calculation of VWAP is the time frame. If we look at the difference below between a 1 minute time frame and a two minute minute time frame we will see there is a discrepancy.

VWAPgraph1
VWAPgraph2

As we can see the two minute does not follow as closely as the 1 minute since it is only “checking” the price every two minutes.

Another ratio we can use similar to VWAP is the moving VWAP (MVWAP) that is similar to a simple moving average. This will use a different period and will sometimes be carried over from day to day depending on the period used. Essentially, instead of starting at one day, we will calculate our MVWAP using the data over the period we wish to study. For example, we can say we wish to take a period of 10 minutes and thus we will essentially have a VWAP that started it’s “day” ten minutes before.

Definition

Open Interest is the total number of options or futures contracts that are “open”, meaning currently owned by an investor and not yet expired.

Details

Think first in terms of options contracts: by owning an option, it signifies that there is interest in actually trading that stock, although at a different price. Since this represents your “interest” in owning it, the “open interest” is how many shares people may be interested in trading, even if they do not actually trade.

Open interest is not to be confused with volume; it is just the total number of options or futures that are owned and not yet expired. A second definition of Open interest is the amount of open interest before the market opens, i.e. the number of open buy orders before the market officially opens, since it shares the same idea (how many shares people are thinking about trading, even though those trades have not yet happened).

Example:

DayTradingOpen InterestSummary
1Trader A buys 1 option and Trader B sells 1 option (for options and futures if there is a buyer there must always be a seller)1There is one option bought currently. The seller does not count in this case.
2C buys 3, and D sells 34A and C now own 4 options between them.
3A sells 2, C sells 3, and D buys 52A still has 1 sold (written), B has 1 sold, C owns 0, D has 2, if we look at the bought the open interest is 2 despite the volume being 5
4C buys 5 and D sells 52Since the options have just changed hands the open interest remains the same. The volume is 5 once again.
5A sells 3, B buys 3, C buys 2, D sells 29A now has 4 sold, B has 2, C owns 7 and D has 5 sold

As you can see these transactions can get very complicated very quickly. The usefulness is undeniable, however, as it shows just how many people “interested” in the option.

Use

Since open interest indicates the number of “open” bought options this can give an indication of market sentiment and therefore the strength of the current trend. If there is very little open interest but a lot of volume it may be a good time to check why so many people are selling off their options.

On the other hand, a sudden jump in open interest can indicate that a rise in volatility is likely but gives little information on the direction of trend.