
A company’s financial statements give investors, managers, and other “users” a complete, honest look at its financial health. Finished financial statements follow a standardized format, letting investors compare different companies in the same industry apples-to-apples.
For the company’s financial reporting team, this presents a challenge – every business’s internal operations are different, but all activities need to be summarized into a standardized format. Businesses assign teams to create their financial statements to meet this challenge – the Income Statement, Balance Sheet, Cash Flow Statement, and other smaller reports issued by every publicly-traded company.
Financial statements follow a logical sequence – each statement needs to be completed and used as an input to the next.
Worksheets
Financial statements are summaries of activities, so the first step in creating any financial statement is to start by building worksheets. Worksheets are updated almost daily with raw data – all sales, expenses, depreciation, and any other flow of money into, out of, or within a company.
Worksheets are the first step in translating the unique way each business operates into easily-understandable, standardized financial statements. This means each company’s worksheets for each type of financial statement is unique – their accounting and financial analysis teams work together to build worksheets that help distill business operations into raw financial data.
Building Worksheets
Worksheets start with the general ledgers of a business, and sort the data into the categories they need to build the standardized financial statements. This is usually a set of spreadsheets – a separate set of worksheets used to build each type of financial statement.
Building worksheets is time-consuming. Some smaller businesses with an owner-operator trying to build their own financial statements may try to skip building worksheets, and instead convert their raw ledger data directly into finished financial statements. This can save some time if they only want to produce financial statements very rarely (like when applying for new bank loans), but lends itself to errors and headaches for companies with normal reporting schedules.
Building new worksheets takes care – any change to worksheets needs to be verified that it will be consistent with previous financial statements, and conforms to GAAP.
Income Statement

Income statements try to answer one simple question: how much money did this business make or lose? This means income statements look at all transactions over a given period of time, usually a quarter or year. The final product of the financial statement is to be able to produce the following equation:
Net income = Revenues – Expenses
It is in this document that revenues are matched with expenses to determine whether a company has net income (revenues are more than expenses) or a net loss (expenses are more than revenues). The worksheet can be a helpful tool in starting and completing an income statement. The format of an income statement can change depending on the type of business.
The basic format is to have the revenues mentioned first and the expenses afterward. The revenue accounts are sales, fees earned, rent revenue, dividends revenue, and any other revenue that all depends on the type of business. The operating expenses are either selling or administrative, but expense can vary depending on the type of business. However, in general, expenses come from advertising, delivery, depreciation of the building, depreciation of equipment, salaries, and wages, and many other things that a business needs to incur to keep the company up and to run.
Revenues
Each company is different, but to simplify let’s say that Apple splits their revenue up into Sales revenue, Interest revenue, and gains on sales of assets. Their revenue would look something like this.
- Revenues
- Sales Revenue – $1,500,000
- Interest Revenue – $250,000
- Gains on Sales of Assets – $100,000
- Total Revenue – $1,850,000
Expenses
Expenses work in a similar format but are obviously categorized as money going out of the company. Apple, if simplified again would have their expenses split into Cost of goods sold, interest expense, commission’s expense, and loss from a lawsuit. Their expenses would look something like this.
- Expenses
- Cost of goods sold – $950,000
- Interest expense – $50,000
- Commissions expense – $75,000
- Loss from lawsuit – $250,000
- Total expenses – $1,325,000
Once this is all tied together at the end the final number is the net income and is calculated by subtracting total expenses from total revenue. This would look like this.
Net Income = $1,850,000 – $1,325,000 = $525,000
Retained Earnings
Retained earnings are a portion of accumulated net income that gets repurposed into other assets and liabilities for the benefit of the firm. At the discretion of the company, retained earnings can also be distributed to stockholder’s as dividends.
Retained earnings are calculated by taking the beginning balance of retained earnings and adding any net income (subtracting net loss) and deducting dividends to get the ending balance of retained earnings for the year-end.
Ending Balance of Retained Earnings = Beginning Balance + Net income (- Net loss) – Dividends
The retained earnings statement is not a mandatory financial statement to have. A company can furnish it to give internal users a better idea if securities should be issued, repurchased, send out dividends, fund new projects, or take in more debt. Its purpose is to help a firm make better investment choices than the previous period.
Shareholder’s Equity
The statement of shareholder’s equity is a stripped-down version of the Retained Earnings statement, with more emphasis on the actual stock of the company. This one is mandatory, and will later be used when building the Balance Sheet.
The statement of stockholder’s equity reports on changes in the stockholder equity accounts such as preferred stock, common stock, additional paid-in capital, retained earnings, and treasury stock. Other accounts such as accumulated other comprehensive income (loss) and noncontrolling interest are included in the statement of stockholder’s equity.
This statement is important because it reveals the contributions and distributions of a company about the accounts just mentioned and the adjustments processed in the period that they cover. In other words, it gives investors a clear picture about what is happening with their stock (diluted with more shares, if the company is buying back shares as treasury stock, ect).

Balance Sheet
The Balance Sheet is the biggest of the main financial statements, and the last to be prepared. The balance sheet will “balance” all of the assets, liabilities, and shareholder’s equity at a specific period of time. While the Income Statement will look at the flow of money over a period (month, quarter, or year), the Balance Sheet is a snapshot – showing its balance at a precise moment in time.
The goal of the Balance Sheet is to give users a picture at a company’s solvency and flexibility. How well are they able to make payments on debt? How liquid are their assets, and how financially flexible are they to whether any unexpected market shocks? This is done by first breaking down, then summing up, the different categories of assets and liabilities, and showing how this compares with shareholder’s equity and retained earnings.
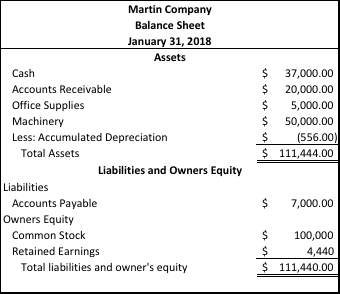
The asset accounts include current assets (cash, accounts receivable, supplies, prepaid expenses, etc.), long-term investments (equity investments), property-plant-and-equipment (land, building, etc.), and intangible assets (goodwill, trademarks, etc.). The liabilities accounts include current liabilities (liabilities within one year or less – notes payable, accounts payable, income taxes payable, salaries payable, etc.) and long-term debt (debt that is more than one year). The stockholder’s equity accounts can come from contributed capital from the issuance of stock, additional paid-in capital, retained earnings, accumulated other comprehensive income, treasury stock, and various equity accounts, which depends on the type of business.
Comparing balance sheets over time will usually give a very clear picture of a company’s financial health.
Cash Flow Statement
The Cash Flow statement can be produced at any point between any of the other statements. Cash does not necessarily mean income, so the purpose of the Cash Flow statement is not to show profits or loss – the Cash Flow Statement bridges the gap of information from the Income Statement and the Balance Sheet.
Like the Income Statement, the Cash Flow Statement shows the flow of money into, out of, and within a business over a period of time. Unlike the income statement, it is not concerned with “net income” or “net loss” – rather, it tries to help paint a picture of liquidity, like the Balance Sheet. The Cash Flow statement needs to answer exactly how the “Cash” line of the balance sheet is calculated.
It is here that the total amount of cash reported on the balance sheet (the ending balance) is explained based on the cash out-flows that are deducted from the cash in-flows. To prepare the statement of cash flows a company looks at prior periods balance sheets to make a comparative analysis (to see what increased or decreased), the current periods income statement to help calculate the net cash provided from operating activities, and any data from transactions that have occurred.
Cash Flow Calculation Steps
Cash flows from operating activities – This should be the bulk of cash flow in most businesses, calculating the cash flow from normal business activities, including amortization and depreciation.
Add Net income + Depreciation expense + Amortization + Loss on sale of plant assets ( – Gain on sale of plant assets) + Decrease in accounts receivables ( – Increase in accounts receivables) + Decrease in inventory ( – Increase in inventory) + Increase in accounts payable ( – Decrease in accounts payable) = Net cash provided (used) by operating activities
Cash flows from investing activities – If a company has investments outside its normal operations, this cash also needs to be accounted for. This often comes from selling assets for most businesses.
Add Sale of plant assets (Subtract purchase of plant assets) + Sale of equipment ( – Purchase of equipment) + Sale of land ( – Purchase of land) = Net cash provided (used) by investing activities
Cash flows from financing activities – This relates to Shareholder’s Equity – how is invested money being used, and the movement of cash into and out of stock.
Add issuance of stocks – Dividend payments – Redemptions and repurchases = Net cash provided (used) by financing activities
Once the amounts of each category are determined, they are combined by taking the sum or difference of the total amounts to get the net increase in cash (more cash coming in than coming out) or net decrease in cash (more cash being spent than being earned).
Net increase (decrease) in cash + Cash at the beginning of the year = Cash at the end of the year (the total cash you see on the balance sheet)
Consolidated Financial Statements and Annual Reports
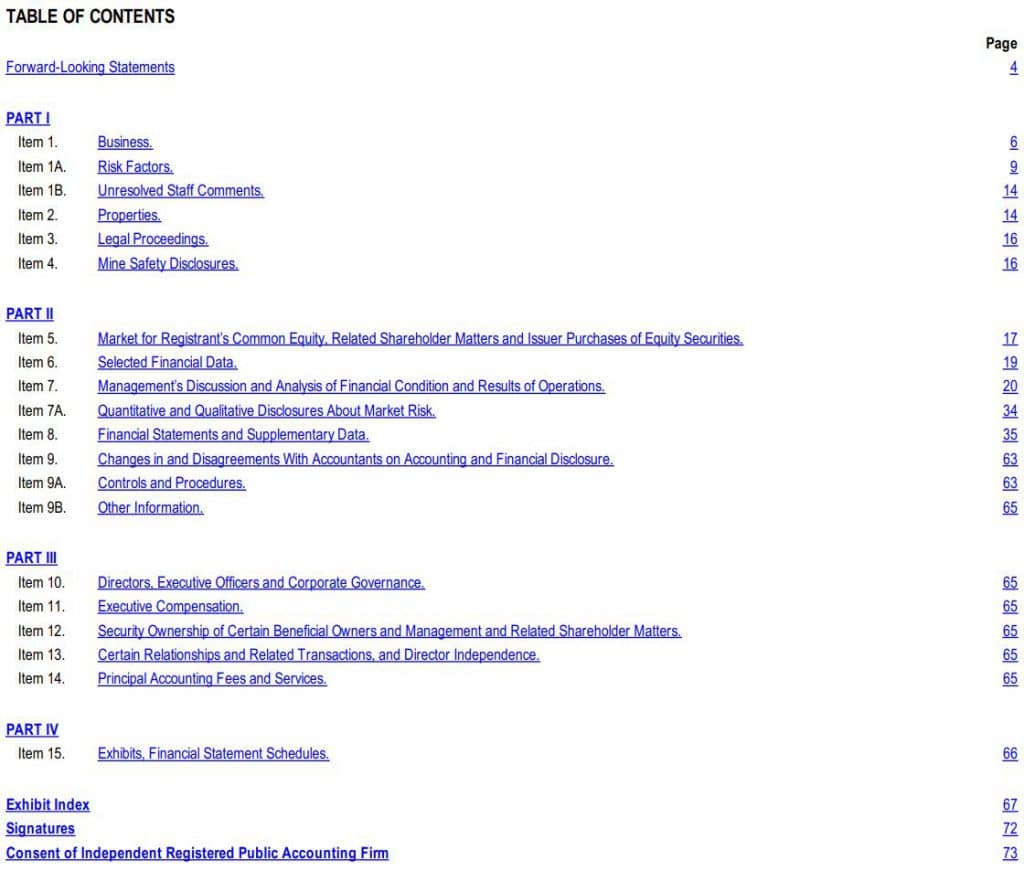
Every company reports their financials every year on a different date depending on their fiscal year. Some do it in the winter, while others choose the summer. This report is an all-inclusive finding on what the company has been doing for the previous year – wrapping all of these financial statements into one big bundle for publication called the 10k.
The report starts with a description of the company and what they do. From there they describe any new changes during the year such as mergers or acquisitions. After a few pages of qualitative descriptions of their year, the reader runs into their financial statements. This is a great way to read over their income statement, balance sheet, statement of stockholders equity etc. and really understand how they have been doing over the past year and if they’re improving or declining.
Below is an example of the table of contents from Nordstrom’s (JWN) 2018 annual report and as you can see it is a lot of information. In short, the nature of a company’s annual report is to provide an enormous amount of information the general public and their stockholders to help them understand how the company is doing. It takes a lot to read through these reports and pull the information needed, but they are created by the companies for a reason and are a great way to learn more about them! You can find the 10k of any company with public stock by looking them up on the Quotes page, then clicking “SEC Filings” on the left.


Get PersonalFinanceLab
This lesson is part of the PersonalFinanceLab curriculum library. Schools with a PersonalFinanceLab.com site license can get this lesson, plus our full library of 300 others, along with our budgeting game, stock game, and automatically-graded assessments for their classroom - complete with LMS integration and rostering support!
Learn More[qsm quiz=181]