
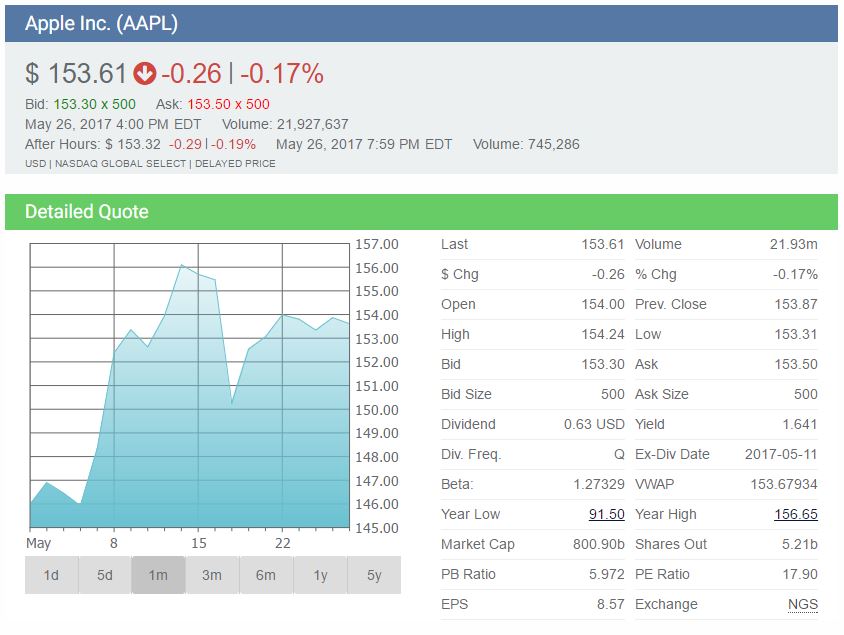
Market capitalization is calculated by multiplying the market price of stock by the number of issued shares of stock.

Market Risk, aka Systemic Risk, which is a measure of how much of a loss an investor is facing while trading.

Though investors often do not analyze it, most do realize there is risk inherent in investing. Never take on more risk than you are able to lose

The buy and hold strategy is essentially just what it sounds like: Purchase stocks and then hold them for an extended period of time. The underlying assumption for the buy and hold strategy is that stocks tend to go up in price over extended periods of time.

Learn the classic market cycles of accumulation, mark up, distribution and mark down so that you can time the market -consistently – and make steady profits any time.

Everywhere you turn there is another proprietary stock market timing system being sold. This is usually a computer program that tries to analyze real-time data for split-second trade decisions

The offer price, or the Bid price is what an investor is willing to pay for an investment. It is only an offer and will not be accepted if the seller is not willing to let go at the offer price.

The difference between the ask price and the sell price is called the “spread” and it is kept by the broker.
If you are brand new to investing then take time to understand what you are reading when viewing a Stock Exchange Symbol and learn Stock Market Investing Basics.

Most traders do not learn about stock trading Risk Management until it is too late, and they experiences losses of varying degrees. Insurance, options, and other tools exist – learn to use them!

An REITs or Real Estate Investment Trusts own, and often operate, real estate but are publicly traded like stock. Profit is paid as dividend to stock owners.

The U.S. Dollar has lost more than 30 percent of its value relative to other world currencies. Shorting the U.S. dollar and buying other world currency ETFs is one way to make money from this trend.

By measuring the compilation of similar stocks instead of just one or two stocks, a Stock Index provides information about that particular market or segment.

A non-bank organization that regularly trades large blocks of stocks. Because of the size of their investments, they qualify for preferential treatment and lower commissions. Institutional investors have less protective regulations as it is assumed that they have more experience with the market and are better able to protect themselves.

A series of technical indicators used by traders to predict the direction of the major financial indexes. Most market indicators are created by analyzing the number of companies that have reached new highs relative to the number that created new lows, also known as market breadth. By weighing those indicators showing Bullish signs against those showing Bearish signs, you are able to weigh your risk in the current market. Read this article for a list of the best market indicators!

A national government that owes money to international financial institutions such as the World Bank, foreign governments, or to foreign lenders.

Many stock analysts have identified market trends related to specific times of the year. The success ratios of these trends are often far stronger than most other indicators.

The Arms Index is a technical analysis indicator that compares advancing and declining stock issues and trading volume as an indicator of overall market sentiment.

Absolute Breadth Index is a market indicator used to determine volatility levels in the market without factoring in price direction.
Advance/Decline Index is a technical analysis tool that represents the total difference between the number of advancing and declining security prices. This index is considered one of the best indicators of market movements as a whole.

By aggregating the value of a related group of stocks or other investment vehicles together and expressing their total values against a base value from a specific date. Market indexes help to represent an entire stock market and thus give investors a way to monitor the market’s changes over time.
A Sole Proprietorship is the simplest, oldest, and most common form of business ownership in which only one individual acquires all the benefits and risks of running an enterprise.

The maintenance margin is the minimum amount of equity that must be maintained in a margin account.

Margin calls happen when you are trading “on margin” and your account value drops to a value below that allowed by a broker – and they force you to sell stocks or add more cash
A corporation is an entity that abides by specific legal requirements that sets it apart as having a legal existence, as an entity separate and distinct from its stockholders (owners).

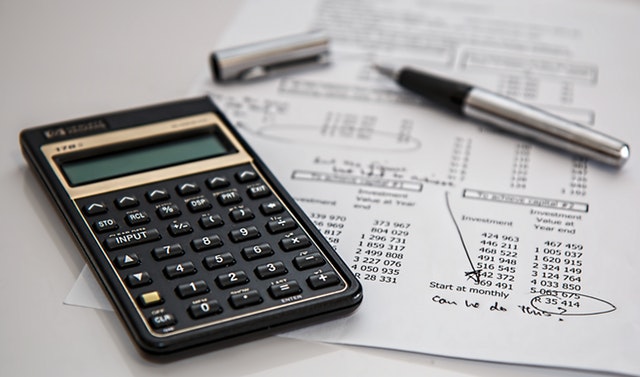
Retained Earnings is calculated by adding the net income to (or subtracting it from) the beginning retained earnings and then subtracting the dividends that were paid to shareholders.

A plan offered by a corporation that allows investors to reinvest their cash dividends by purchasing additional shares or fractional shares on the dividend payment date.
Technical Analysis is the use of technical indicator to predict which direction the stock price will move in the future. Technical indicators use past stock prices to calculate their value.

Blue Sky Laws are state regulations governing the sale of securities and mutual funds.

An investment service that allows individuals to purchase a stock directly from a company or through a transfer agent. Not all companies offer DSPPs and the plans often have restrictions on when an individual can purchase shares.
Since the bottom fell out of the stock market in 2008, investors have been shifting money from stocks into bond funds. Since 2007, there have been $1.39 trillion invested in Bond Funds versus $193 billion in stock funds. The most logical explanation is an attempt to find income and safety, but are bonds truly safe?

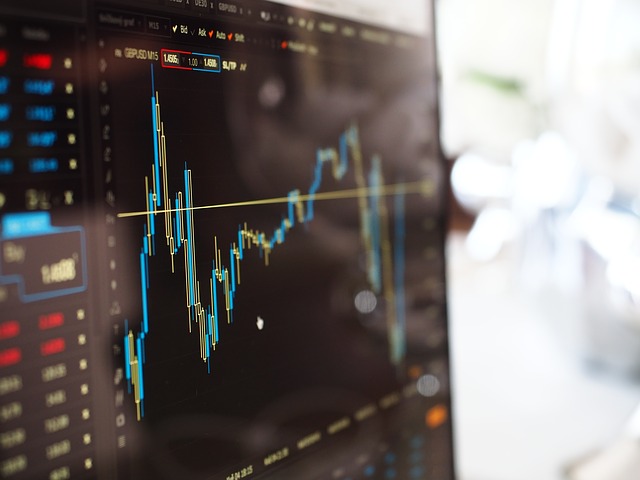
In the world of stock analysis, fundamental and technical analysis are on completely opposite sides of the spectrum. Fundamental analysis focuses on financial statements, while technical analysis looks at stock charts

Falling Knife is a phrase used for a stock where the price has dropped significantly in a short period of time. A falling knife security can rebound, or it can lose all of its value where the shares become worthless. Trying to catch a “falling knife” right as it rebounds is dangerous!
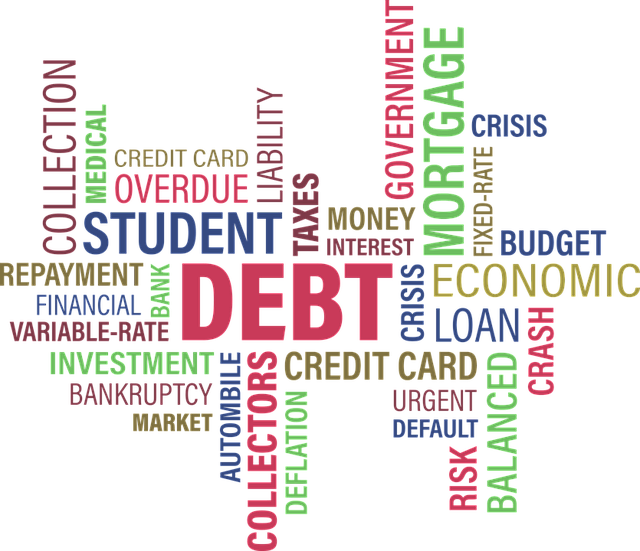
The total amount that the federal government has borrowed including internal debt (borrowed from national creditors) and external debt (borrowed from foreign creditors).

A Stop Limit is an order that combines the features of stop order with the features of a limit order. A stop limit order executes at a specified price (or better) after a specified stop price is reached.

Horizontal Integration refers to the merger of companies at the same stage of production in the same or different industries.

US federal legislation of 1890 that prohibited the creation of monopolies by outlawing direct or indirect attempts to interfere with the free and competitive nature of the production and distribution of goods. Amended by the Clayton Act of 1914. Also called Sherman Act.

An order to buy or sell a stock at a fixed price. This order is active until 1) the trade is executed, 2) the investor decides to cancel it or 3) a specified time period elapses.
Stock prices are a direct result of supply and demand. All the other influences like debt, balance sheets, earnings and so on affect the desirability of owning (or selling) a stock. This article details why supply and demand create changes in stock prices, and what a drop in price means in terms of supply and demand.

Decreasing the long-run average and marginal costs that come from an increase in the size of a factory or plant. Economics of scale can be from the inner workings of an organization. This would include the lower cost from adding technology and better organization.
A short call option position where the writer does not own the specified number of shares specified by the option nor has deposited cash equal to the exercise value of the call.

A high-risk bond with a low credit rating. Junk Bonds usually have a much higher yield than investment-grade bonds.

A 403(b) is an alternative retirement plan to a 401(k) plan offered by non-profit organizations, rather than corporations.

When a company offers to trade one security in return for another security.
Stock market prices are affected by business fundamentals, company and world events, human psychology, and much more. Read this article for descriptions of a few of the main factors than affect stock market prices.
You do not need anything else on a stock chart but the candles themselves to be a successful swing trader! And, there is nothing that can improve your trading more than learning the art of reading candlestick charts.

In technical analysis, “Support” is a price trend line that a stock usually won’t fall below (at least in the short term), while “Resistance” is a price trend line that it has trouble rising above
ADX is an indicator used in technical analysis as an objective value for the strength of trend.

If you perform four or more day trades in a 5 day period you may get flagged by the SEC as a “Pattern Day Trader.” This can cause you to lose your margin account status until you deposit enough cash to have $25,000 or more in your account. Many beginning traders have been bitten by this rule!
An inverted dead cat bounce will occur when a company discloses news that will send the stock soaring by 5% to 20% or perhaps even higher.