One metric that companies use to assess effective cash flow management is the cash conversion cycle (CCC).

The Cash flow of a company can be analogous to its life bloodline. Efficient cash flow generation and management are critical to the success of an enterprise in conducting its daily operations, pursuing investing opportunities, and meeting financial obligations.

Poor management of cash flow can lead to inability to meet payments, increasing the probability of financial distress and bankruptcy.

Cash Conversion Cycle is defined as the length of time (in days) needed to transform inventory purchases into actual cash receipts. It takes into consideration the company’s time commitment towards collecting receivables and paying its suppliers, and is an important measure of a company’s internal liquidity.

The CCC can be calculated as the sum of the inventory conversion period, receivables conversion period, and the parables conversion period.

CALCULATION STEPS

Firms typically follow a working capital cycle, whereby the acquisition of inventory is stored for a certain period of time, and subsequently sold, thus converting such purchases into sales and ultimately cash. This is precisely what the cash conversion cycle represents.

As a formula,

Days in Inventory Outstanding (DIO) + Days in Sales Outstanding (DSO) – Daysin Payales Outstanding = Cash Conversion Cycle

Calculating the CCC can be done in 4 steps, and requires information from the 3 main working capital accounts: Inventory, Accounts Receivable, and Accounts Payable. Note that certain income statement items are needed as well.

Assume the following:

Net Revenue

$40,000

Inventory

$1,000.00

Cost of Goods Sold

$25,000.00

Average Receivables

$850

Average Payables

$2,500

Cycle Period (Days)

365

STEP 1: DETERMINE THE DAYS IN INVENTORY OUTSTANDING (DIO)

First we calculate the Inventory Turnover – defined as the number of times inventory is sold in a year:

Inventory Turnover

Then calculate the Inventory Conversion Period, which is the average time it takes a firm to convert inventory purchases into sales:

Inventory conversion Period

STEP 2: DETERMINE THE DAYS IN SALES OUTSTANDING (OR DSO)

First find the Receivables Turnover – the average number of times that receivables are turned over (or collected):

Receivables Turnover

Then find the Receivables Conversion Period (DSO), which measures the average time it takes to convert receivables into actual cash receipts.

Days in Sales Outstanding

STEP 3: DETERMINE THE DAYS IN PAYABLE OUTSTANDING (DPO)

Calculate the Payables Turnover Ratio,

Payables Turnover Ratio

Followed by the payables conversion period

Paybles Conversion Period

STEP 4: CALCULATE THE CASH CONVERSION CYCLE ( CCC)

The final step is to sum up the resulting inventory, receivables, and payables conversion periods, calculated above:

Cash Conversion Cycle

Alternatively, we can express the above relationship using the turnover ratios we determined:

Turnover Ratio

It takes on average approximately 60 days for the company to inventory purchase, pay its suppliers, collect its receivables, and receive the cash

INTERPRETATION AND ANALYSIS

A low CCC is conducive to healthy working capital levels, profitability, liquidity, cash flows, and stable operating cycles.

From the example above, it takes approximately 60 days to convert inventory purchases into actual cash receipts. Needless to say, a short cash conversion cycle is desirable, and generally promotes healthy working capital levels and liquidity, cash flows, profitability, and stable operating cycles.

Understanding a company’s cash conversion cycle requires an examination of its 3 working capital accounts: accounts receivable, inventory, and accounts payable.  Managing the CCC involves managing the receivables, inventory, and payables functions.

Accounts Receivable

While an increase in receivables generates an increase in sales, holding receivables for a long time also ties up cash (since cash is received only when receivables are actually paid. Therefore, companies have an incentive to reduce the length of time that their receivables are outstanding. We can see this from the example of the equations above. Lower (or decreasing) outstanding receivables increase the receivables turnover ratio, which translates in a faster receivables conversion period (or a lower DSO). This in turn translates into a lower CCC.

Inventory

The same relationship applies to inventory. Decreasing the amount of time that inventories are held increases the inventory turnover ratio, which in turn decreases the inventory conversion period (or DIO). The effect is a lowering of the cash conversion cycle, an advantageous outcome.

Accounts Payable

The above causal relationships are reversed when dealing with payables. Companies have an incentive to lengthen the amount of time it takes to pay down payables, since that frees up and provides cash now.  Paying down payables requires the usage of cash, while an increase in payables from one period to the next increases cash.  From above, we see that higher average payables would lower the payables turnover ratio, and increases the payables conversion period (or DPO). Since the DPO is a negative component in the CCC equation, a higher DPO translates into a lower CCC – which is good.

CONCLUSION

Measuring the cash conversion cycle is important to liquidity, working capital, and the operating cycle of a company. Good management of the CCC can also enhance a company’s cash flows, allowing it to effectively make sound investing and financing decision. Managing the CCC entails efficient inventory, receivables, and payables functions, and should be part of a company’s overall operational strategy.

Keywords: Inventory Management, Fundamental Analysis, Accounts Payable, Accounts Recievable

Capital funding are monetary resources provided to another party for business (or non-business) purposes.

Capital funding is typically invested by a party or parties with the expectation of some form of monetary gain or return at some future time.  Capital funding plays an important resource allocation function, as its productive use plays a critical role in promoting economic growth

Who uses Capital?

Capital is provided to and used by a multitude of individuals, organizations, and businesses such as

  • Governments
    • Federal, state, or municipal governments are major recipients of capital
  • Non-Governmental Organizations
  • Corporations such
  • Private Companies
  • Start-up Businesses and Entrepreneurship Ventures
  • Charities, Foundations, and Endowments
  • Individuals

What is Capital Funding used for?

Some common uses of capital funding include

  • Capital can be used for investing purposes. For example, businesses use capital to
    • Buy land
    • Purchase equipment and fixed assets
    • Make expenditures related to their projects or activities
    • Invest resources in international markets
    • Pay their expenses and costs
  • Real estate investment and development
    • Capital can be used to purchase or develop property such as
      • Land
      • Commercial property
      • Office Towers
      • Buildings
  • Investing in financial securities by institutions, investors, and general public
    • Capital is used to
      • Purchase stocks, bonds, derivatives, or other financial securities
  • Lending purposes
    • Capital can be lent to individuals or entities with the expectation of being repaid the principal along with interest
  • Starting a business or venture
    • Capital funding is provided to entrepreneurs seeking to start a new company, and who may lack sufficient funds to do so
    • Can also be used to expand a small business and provide it with necessary resources to take it to the next level
  • Supporting charity work or good causes
    • Various charities and foundations use capital to
      • Help developing countries with urgent and humanitarian needs
      • Support those who are in need dire situations and are in need of resources
      • Create funds to treat or find cures for various diseases, illnesses, and conditions
  • Capital Preservation Purposes
    • Capital can also be preserved and gradually grown by placing it in safe interest-bearing accounts

Types of Capital Funding

Two important types of capital are equity and debt

  • Equity Capital
    • Represents an ownership stake by the capital provider
      • E.g., by providing a certain amount, an investor can own a percentage of a business
    • Common types of equity capital include
      • Common equity
        • Represent the investment in a company’s shares or stocks
        • Traded on secondary markets such as stock exchanges
      • Preferred Equity
        • An ownership stake whereby a periodic fixed percentage of return is demanded by investors
        • Possess features and characteristics of both equity and debt capital
      • Private or Venture Capital Equity
        • Equity Capital whose terms and characteristics are set uniquely and privately by the providers and users of the capital
        • Venture capital represents funds for start-up ventures and businesses,, projects, or activities
    • Usually the riskiest form of capital
      • E.g., investing in the shares of a public corporation entails the risk of losing the entire capital provided
    • Investors require a return on equity capital that is commensurate with the risk of equity capital
  • Debt Capital
    • Represents lending of capital
    • Characteristics and features include
      • a principal amount (lent amount) that must be repaid at a future date
      • Interest is applied to borrowed obligation that must be repaid periodically
      • A time horizon representing the specified time by which the borrower must repay the full obligation
      • Sometimes include the use of collateral and covenants, which are assets or funds provided as backup or reserves to protect against borrower default or non-payment
    • Some Types of Debt Capital
      • Senior Debt
        • Holders of senior debt are guaranteed to be repaid first in line, should a borrowing party default or in the event of bankruptcy
        • Will have strict collateral and covenant requirements
        • Usually command a lower interest rate than junior debt due to perceived safety of capital
      • Junior Debt
        • In the event of default of bankruptcy, holders of junior debt are paid only after senior debt holders’ obligations are satisfied first
        • Considered riskier than senior debt, and thus will usually entail a higher interest rate
      • Junk or high-yield debt
        • Debt capital that is highly speculative in terms of its probability of being repaid
        • For example, recipients of junk or high yield debt (such as companies) could be in highly precarious financial situations (such as facing or emerging from bankruptcy)
        • Considered the riskiest type of debt capital and thus a high interest rate will be applied

Conclusion

Capital funding is the provision of monetary resources or capital for productive uses. Capital provided by investors or other parties is used by various entities such as governments, companies, organizations, and individuals in order to fund their functions and operations. In most cases, capital provided is compensated by some form of return to the provider. Two important types of capital are equity and debt. Equity capital represents an ownership stake, while debt capital is a form of lending.

Key Words: Capital, Funding, Monetary, Resources, Business, Investing, Investors, Governments, Corporations, Private, Companies, Charities, Startup, Ventures, Charities, Foundations, Endowments, Return, Land, Equipment, Fixed Assets, Operations, Funding, Financing, Expenditures, Real Estate, Financial, Securities, Stocks, Bonds, Derivatives, Lending, Borrowing, Entrepreneurship, Common, Preferred, Equity, Holders, Stock, Shares, Debt, Principal, Interest, Senior, Junior, Junk, High, Yield, Secondary, Market, Exchanges,

Account Payables Management refers to the set of policies, procedures, and practices employed by a company with respect to managing its trade credit purchases.

In summary, they consist of seeking trade credit lines, acquiring favorable terms of purchase, and managing the flow and timing of purchases so as to efficiently control the company’s working capital.

The account payables of a company can be found in the short-term liabilities section of its balance sheet, and they mostly consist of the short-term financings of inventory purchases, accrued expenses, and other critical short-term operations.


WHY COMPANIES FINANCE THEIR PURCHASES

Purchasing inventory, raw materials, and other goods on trade credit allows a company to defer its cash outlays, while accessing resources immediately.

When managed appropriately financing purchases can contribute to effective working capital management.

A company that employs best practices with regards to payables management can reap the benefits of stable operating cycles that provide a stable source of operating cash flows and place it in a good liquidity position with respect to its competitors.


OBTAINING TRADE CREDIT

Companies seeking trade credit must demonstrate that they meet certain criteria with respect to their creditworthiness and financial condition.

This typically entails credit analysis by the supplier.

The financial statements of the company are analyzed, paying particular attention to its working capital, short-term liquidity and short and long-term debt to gauge its ability to meet obligations.

The final product of such analysis is usually some form of a credit risk rating.


PURCHASE AND PAYMENT TERMS

The purchase and credit terms obtained will depend on the company’s risk assessment above.

Companies that are financial stable can benefit from favorable terms (e.g. lengthy repayment periods).

For example, a company might be offered a sales on credit term of 5/10 net 30 implies a 5% discount on the purchase amount if payment is made within 10 days of billing date.

If the discount is not taken, the full invoiced amount is due in 30 day.


MANAGING PAYMENTS

After entering into purchase agreements with a supplier, the company has the responsibility of fulfilling its payment obligations.

The Accounts Payable department is accountable for this function, and performs tasks such as communicating with suppliers, sending payments and reconciling bank records, as well as updating and performing related accounting entries

Managing payables also include the expense administration with respect to the company’s own employees.

Expenses such as employee travelling, meals, entertainment, and other costs related to doing business for the company are administered by the payables department and must be managed appropriately.


EVALUATING THE PERFORMANCE OF PAYABLES MANAGEMENT

Accounts payable are one of 3 main components of working capital, along with receivables and inventory.

Understanding how these 3 accounts interact among each other and the resulting effects on working capital levels, cash flow, and the operating cycle can help in managing and evaluating payables management.

An appropriate balance must be struck, whereby the advantage of deferring cash outlays using trade credit is weighted against the risk of excessive short-term credit.

It is therefore important to maintain optimal utilization of credit lines and timing of payments, and create a balance between the need for cash, working capital, and liquidity.

A number of metrics and short-term financial ratios can be used to evaluate the performance payables management.


 Payables Turnover Ratio

Management can use this ratio to measure the average number of times a company pays its suppliers in a particular period.

A higher number than the industry average indicates the company pays its suppliers at a faster rate than its competitors, and is generally conducive to short-term liquidity.


Days in Payables Outstanding (DPO)

Measuring the average length of time it takes a company to pay for its short-term purchases in a period, the DPO can be used by management to determine an optimal timing of payments for its payables.


Cash Conversion Cycle

An important measure of the length of time required to turn inventory purchases into sales, and subsequently into cash receipts.

Using the CCC, management can assess the interaction of payables with the 2 other working capital accounts: receivables and inventory, and the resulting effects on cash flow.

A low CCC is highly desirable. A company can shorten the CCC by for example, lengthening its terms of purchases.


Net Working Capital (NWC)

NWC is the difference between current assets and current liabilities. High levels are desirable for short-term liquidity.

A decreasing pattern or trend in NWC can be attributed to increasing levels of payables, and thus can serve as a warning sign of excessive short-term credit.

A negative NWC (particularly when persistent) is a red flag for a lack of liquidity or potential insolvency.


Current and Quick Ratio

Two other liquidity measures, the current ratio expresses the NWC equation above as a ratio between current assets and current liabilities. Holding all else equal, rising A/P levels will reduce both the current and quick ratio. These ratios can be used to assess the impact of increasing payables on short-term liquidity.


CONCLUSION

The Accounts payable of a company is an important working capital account. Effective payables management can enhance a company’s short-term cash flow position through the design of optimal timing of payments to suppliers.

However, important considerations should be given to excessive financing, as that has a direct impact on the credit risk of the company and its short-term liquidity.

The idea behind insurance is that random bad thing can happen to just about anyone, and sometimes those random things are expensive to resolve.  Car crashes, medical emergencies, and flooding can destroy your personal saving and investing accounts if they happen to you and you’re not prepared to deal with them.

How Does Insurance Work?

insurance

To reduce the financial risk associated with these unexpected events, insurance companies developed programs to spread the risk among a large group of people.  Each member of the group pays a fee, called an insurance premium, to receive coverage for that particular risk.  If a member of the group is harmed by an unexpected event which the insurance policy covers, the insurance company will help pay for the damages. How can the insurance company afford to do that?  Insurance is based on probabilities.  Insurance companies expect that of 1000 people who are insured, only 2% of the people, for example, will be harmed and need compensation.  So if 1000 people premiums but only 20 are harmed, the insurance company will have enough money to cover those 20 claims.  In other words, insurance is a way to protect against risk.

In most situations, the insurance compensation following an event does not cover 100% of the cost incurred.  The individual filing a claim for damages needs to pay a certain amount himself before the insurance coverage “kicks in.” This amount is called the deductible.  Why is there a deductible?  So that you will share in the risk and try to be careful with your health and your property.

There are insurance policies designed to protect against different types of risk, but they generally fall into four major categories: car insurance, property insurance, health insurance, and life insurance.
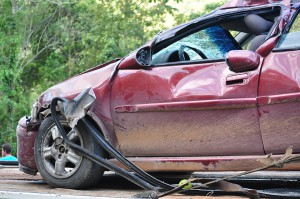
Car Insurance

Car insurance, or automobile coverage, is insurance you get to protect against risk associated with your vehicle, both while driving and when your car is parked. There are four types of car insurance: Liability, Personal Injury Protection, Collision, and Uninsured Protection. All car insurance policies are a combination of these four types.

Liability Coverage

crash-1308575_960_720

Liability coverage is required in most states if you want to drive. This coverage exists to pay the repair and medical costs of any property or person damaged as part of an accident that was your fault. Liability coverage is required because it reduces risk for the other drivers.  If you cause an accident, the other parties know that their recovery costs will be covered by your insurance company.

If you get into an accident with someone who does not have liability coverage, and the accident was his/her fault, your only option to get paid for your damages is to sue the other driver directly.  Just be aware that if the person doesn’t have auto insurance, there’s a good chance they probably do not have the money to pay for the damages either.

Liability coverage does not cover you or your own vehicle.  It only covers damage that you cause while driving. If you are hit by someone who does have liability insurance, their coverage will pay for your repair costs, medical bills, and other expenses, depending how much at fault the other driver was. For example, if both people in a car crash are equally at fault, each person’s liability coverage will pay 1/2 of the other driver’s expenses.

Personal Injury Protection

Personal injury coverage exists to cover your own medical expenses in the event of a car accident, regardless of who is at fault. Personal injury coverage is optional, but if you are even 10% responsible for the crash, you will have to pay 10% of your medical bills out-of-pocket if you don’t have personal injury coverage.

Collision Coverage

Collision coverage covers the repair or replacement cost of your vehicle, regardless of who is at fault. Collision coverage is generally less important than personal injury coverage, but if you have an expensive car, you will be more likely to get collision coverage to protect against potential repair costs due to a collision.

Uninsured Protection

Tips To Get Rich Slowly
Uninsured coverage is less expensive in states where liability insurance is required for all drivers, since it is less likely you would get in an accident with an uninsured driver.

All of the insurance coverage previously mentioned is based on the idea that if you are hit by someone else, their liability coverage will pay for your damages. However, if the other driver is not insured, you could have a lot of trouble actually getting any money to cover your expenses. Uninsured insurance protection is designed specifically to protect against getting hit by an uninsured driver.  Your insurance company will cover you immediately and try to get their costs back themselves instead of making you chase the other driver for payment.

Determining Your Car Insurance Premiums

Your insurance premium is the amount the insurance company charges you for the coverages you elect to have.  The cost of your premium depends on several factors, including your age, the age of your car, previous accident history, the type of car you drive, and the amount of time you spend on the road.  Basically, the higher risk you present, the higher your premium cost will be.  This means if you are in an age group that is more likely to be in an accident (like a young, less-experienced driver), drive a very expensive car (which costs more to repair), or have a history of getting in accidents, your premium will be higher.

On the other hand, your premium will be lower if there are several factors demonstrating you will be less likely to file an insurance claim.  This includes having a history of being a safe driver, owning a car that includes safety features such as airbags and anti-lock brakes, driving a car that is less expensive to repair, and living in an area with a low crime and few accidents reported.  If your car is less likely to be damaged or stolen by thieves, and if the drivers around you are also safe drivers, the risk you pose to the insurance company is lower, so your premium will also be lower.

Property Insurance

Property insurance started out as insurance policies to protect against fire, but today it also helps protect against theft, faulty construction, lightning strikes, and other potentially expensive disasters that affect your home.

Homeowners Insurance

tornado-567723_960_720

If you own your home, you will need homeowner’s insurance. If you have a mortgage on your home, your bank or mortgage company will require you have homeowner’s insurance to help protect your investment.

Homeowner’s insurance covers your home and everything in it against damage and theft. It is there to help reduce the financial risk you could suffer due to events like a robbery, a fire, or a natural disaster.  Because you have coverage, you might be tempted to file a claim if you accidentally broke your television.  After all, your TV is inside your home.  But remember that when you file a claim, you are responsible for paying the deductible first before the insurance company pays their portion, and that could mean you paying the first $500 which could buy you a new TV anyway. 

One problem with filing a claim usually comes from proving you owned something to begin with. Insurance companies generally recommend people walk through their homes with a video recorder once per year to document everything that is in the home.  By doing this, you have video documentation of your items and can use the video later to show that something was in the home before it was stolen or destroyed.  While making the video, add important details verbally while capturing your footage.  Simply saying something like “This television is a Vizio brand.  It was purchased in November of 2019 for $600.” will help the insurance company determine the replacement value of the items that were damaged or stolen.

Homeowner’s insurance is generally more expensive for older buildings with out-of-date or unsafe electrical wiring and plumbing and for homes in higher crime areas. Homeowner’s insurance is less expensive for homes with more up-to-date insulation, new wiring, new plumbing, in safer neighborhoods, with better fire safety equipment (like smoke alarms and sprinklers), and better locks and safeguards against burglary.

Renter’s Insurance

Renter’s insurance covers your personal items when you are renting a home or apartment from someone else.  The owner of the building has homeowner’s insurance to cover the building structure, so renter’s insurance is only needed to cover your property.  This means that renter’s insurance is typically much cheaper.  If you are a college student with mainly electronics, clothing, and a few pieces of furniture, your premium could be less than $20 per month.  If a building has a fire, for example, the homeowner’s insurance would cover the building repair, and the renter would be compensated for damage or loss of their personal items through their own renter’s insurance policy.

The factors that make homeowner’s insurance more or less expensive apply in the same way to renter’s insurance.  The precautions you take to keep your items safe will most likely reduce your premium cost.  However, there is one factor you may not be able to control.  If you are on the ground floor of a building, your renter’s insurance will probably be more expensive than someone’s on the 10th floor since your place would be more likely to be burglarized.

Health Insurance

Health Insurance is designed to cover your expenses if you get sick or injured, including all medication and hospital care. Health insurance is important.  Without it, you could find yourself in tens or hundreds of thousands of dollars in debt if an unforeseen medical emergency occurs.

Health insurance is typically provided through your employer, but if you are an independent contractor or in a lower-paying job, you may need to buy health insurance on your own.  In 2010, the Affordable Care Act was passed into law, requiring that all individuals have some sort of health insurance coverage.  A health care marketplace was created which allowed individuals an online place to “shop” for health insurance.  Since 2014, everyone who can afford health insurance is required by law to have it  unless they can demonstrate that their earnings are below a certain dollar amount and they cannot afford it.

For the elderly, Medicare is a national health insurance program that covers all medical costs of people over the age of 65. For the poor, Medicaid is a national program providing health insurance to people whose earnings fall below a certain threshold.

Life Insurance

Tips To Get Rich Slowly
These types of life insurance policies are common both for family and retirement planning.

Life insurance was first created to provide for a deceased person’s family when they died.  The insurance payout would cover the cost of funeral expenses and would provide some cash to live on until the surviving family members found other means of support. Life insurance still fulfills this role, but some policies also have a cash value.  Depending on how long you hold a policy, you can receive a cash payout at the “expiration” of the policy.

For example, you may have a policy which pays $200,000 to your survivors when you die.  You pay a $20 monthly premium for that coverage.  If you make payments for 25 years and live until age of 65, the policy then “cashes out” and pays you a lump-sum of $50,000 to use in your retirement years.

Schedule a call

Get PersonalFinanceLab

This lesson is part of the PersonalFinanceLab curriculum library. Schools with a PersonalFinanceLab.com site license can get this lesson, plus our full library of 300 others, along with our budgeting game, stock game, and automatically-graded assessments for their classroom - complete with LMS integration and rostering support!

Learn More

[qsm quiz=78]

Challenge Questions

  1. Why do people take out insurance?
  2. Why do the police demand that you drive with insurance?
  3. Using your own words, explain how insurance works in terms of demand and how people are charged.
  4. What is the difference between liability and deductibility?
  5. List 5 different things that are commonly insured.

Stock Portfolio

Once you have chosen your investment strategy it is time to start building your stock portfolio. Your strategies should be inline with your overall investment strategy such as whether you are day trading and the level of risk you are looking for. Although we are sticking to stocks in this article, a lot of the principles can be applied to other assets as well.

There are thousands of different way’s to choose stocks and the chosen strategy can vary widely depending on the type of strategy you wish to employ and your objectives. Since there are so many we will look at some of the more popular strategies.

Note: For most investors choosing individual stocks is not always the wisest decision and should focus more on asset allocation and diversification. On a virtual trading site, however, we have the luxury of being able trade with large of sums of money and can make trades without worrying about the losses.

Screeners

No matter what strategy you use, a stock screener is an absolute must to find what stocks you are looking for. With a screener you can easily select penny stocks, or ETF’s or find out which company has had a large increase in the few weeks.

Strategies

Random Picks

Picking a portfolio of 100 stocks randomly has been proven, on average, to beat the market. So if you don’t know where to start, you can just pick random stocks and still hope to get a decent return.

High Risk

A virtual exchange is a perfect location to practice high risk trading. To obtain a high risk portfolio, one would select penny stocks, triple leveraged ETF’s like oil 3X UWTI. Penny stocks are generally just that, stocks that cost a few pennies. High risk may be scary but it also has the potential for huge rewards.

Buy What You Know

The best way to start of with picking stocks is to pick a stock of a company you already know about. If they have reached you as a customer, chances are they have done something right. If you see a company that not many know about that is becoming more and more popular with your friends you can get the stock before anyone even knows about it and hope to get huge returns. Another reason this works is because brand image is a very important and if you know the brand, then the company has already succeeded in something that has a lot of value.

Word of Mouth

On the other hand, one should generally not buy a company because a friend has recommended the stock because he made lots of money. In general, this strategy works very poorly since by the time you have bought you have already lost the potential for making money. This means the news you received from your friend that the company is a buy is usually quite old and stale. The other reasons is that even if you know someone who works in finance and is at the very forefront of news for a certain company, you still have to trust that he has given you a good buy.

Fundamental Analysis

This process involves researching a companies “Fundamentals” to try and ascertain what the value of the stock should be. Fundamentals include their earnings reports, forecasts, competitiveness in it’s industry and many more. Finance students will often learn about the fundamental analysis in university and is how most analysts come up with a stock rating. Essentially, if the stock’s value is under the current price, it would be a buy and if the stock’s value is below it would be a sell. If the value was roughly the same as the current price, it would be a neutral position (or hold) meaning you shouldn’t sell if you already have it but it is not a buy either. Analysts generally have one field of expertise in an industry they know more in, as the industry they are in is important.

Price Earnings

One way to quickly look at stocks that could be worth purchasing is through P/E ratio or Price to Earnings. This gives an indication of how expensive a stock is with regards to it’s earning potential. A stock with a lower P/E ratio is generally more desirable than a stock with a high P/E ratio.

Technical Analysis

Using charts, patterns and a variety of other tools, technical traders try to predict what the market will do or determine the strength of a trend.

Trend following

A very old adage in the stock market is that “The Trend is Your Friend”. When in a bull market buy you can buy the SPY ETF to ride the trend until you hit a bear market and then short SPY while in a bear market. Technical analysis can be useful here as well to get a better idea of whether the market is trending upwards or downwards.

Day trading

Day traders typically use technical analysis to determine strength of a trend or predict a trend to make a profit over a few minutes to at most a day. In order to successfully day trade you will need to find stocks with higher volatility, have sufficient volume and have a low enough price to be able to invest larger quantities of money and thus be able to buy more shares.

Dividend

A lot of investors like to have reliable companies with strong dividend history. By looking for high dividend yield’s and a good history of dividends, one can get a good reliable stock that will provide income every quarter or month.

Market Cap

“Too big to Fail” is the motto of this investment strategy. With this, someone would pick companies with very high market capitalization, that is to say, a very large company. This is essentially saying that the company has done well so far, why shouldn’t it in the future. These stocks tend to be “blue-chip” stocks as well.

Contrarian

This strategy essentially does the opposite of the market sentiment. When most people are buying, you are selling and when most are selling, you are buying.

Warren Buffet

One of the greatest investors of all time uses a variety of the strategies we’ve seen above but can be summed up pretty easily. Warren Buffet essentially buys great companies at a good price. Some of the ways he chooses an investment are as follows:

  1. Competitive Advantage – A company has to have a great competitive advantage over the competition. This could be anything from a patent to economies of scale.
  2. Brand – A good brand provides a huge competitive advantage, especially for simple every day things like ketchup and toothpaste.
  3. Reasonable Price – A great company isn’t a great company if it is very expensive right now. Warren buffet has said that what a company costs is the price, but what you get is the value.
  4. Proven – A company has to have a long and stable track record of earnings before he will invest in them.

Warren Buffet’s approach is therefore close to someone using fundamental analysis but throwing out anything that isn’t a good company with a great brand.

A portfolio is a collection of assets that contribute collectively to an overall return.

There are many different reasons you could create a portfolio, and you need to define your reason or objective from the very beginning before adding stocks and other securities to your account.

How you would define the objective of your portfolio depends on your time frame and your risk-tolerance.

The following table gives a good representation of portfolio objectives dependant n the two factors:

Portfolio-Objective-Guidance-Table-300x169

Source: www.edwardjones.com

What should I buy?

Now that you have determined what your investment objective is, you can decide on what assets you need to buy for your portfolio. You can choose from within stocks, bonds, derivatives and alternate investments.

Before you choose what you want to buy, however, you have to ascertain whether the portfolio will be actively or passively managed.


Stocks

Within Stocks, you can choose in between many different types, a few of which are:

  • Blue Chip: These are mature, stable companies that are well-known globally and generally pay good and timely dividends. You would buy these for a Balanced Growth and Income Portfolio.
  • Penny Stocks: These are highly volatile stocks that trade more on supply and demand than market news. You would buy these if you are completely growth focuses.
  • Market Cap: You can purchase stocks according to their market capitalization, which basically gives an idea as to what stage of the life-cycle t is in. A smaller market-cap stock would generally be bought for a Growth Focused Portfolio, but a Large Market Cap company stock would be bought for Income purposes.

Bonds

Bonds are fixed-income instruments, which basically means that they pay a certain amount periodically. These are perfect of an income based portfolio.

One has to be careful with this assumption because not all bonds have the same risk and hence bonds with higher risk, and subsequently lower ratings, could be bought for a growth portfolio due to its price volatility.

Derivatives

You can make use of derivatives such as options, futures and swaps in your portfolio for both income and growth reasons. If you are being speculative, then you would use it for a growth portfolio, whereas if it is for hedging, you would use it protect your income portfolio.

Alternative Investments

The biggest alternative investment out there is real estate. You can buy a rental property for income purposes, or you could be more speculative and buy land in foreign countries to capitalize from capital appreciation in a growth portfolio

How to put it Together

The percentage of your portfolio value that is invested in certain types of assets described above dictates which objective your portfolio has met.

For example, 50% in growth assets and 50% in income assets leads to a “Balanced Growth and Income Portfolio”.

Adjusting the percentages up and down changes the direction and objectives of the portfolio.

Conclusion

Now you have an idea as to how to go about setting up a portfolio. The main point to take away from here is to know what the objective of your portfolio is based on your risk tolerance and time-frame, and then to start filling up the portfolio with income or growth assets according to the percentages you need to maintain.

Price ceiling is a government-mandated limit on the price that can be charged for a given product, such as a utility or electricity.

The intended purpose of a price ceiling is to protect the consumers from conditions that would make a vital product from being financially unattainable for consumers.

Example of Price Ceiling

American soldiers returning from World War II found apartment costs in New York to be unaffordable.

As a result, the City of New York instituted a price ceiling on rent.

Prior to the return of the American soldiers, assume that apartments had been renting for $500 a month, and there was a demand for 600,000 apartments.

Now that the City of New York has imposed a price ceiling, by law, rent prices cannot exceed $400.  At the lower price, demand obviously increases to 800,000 apartments.

Who benefits and who loses from a Price Ceiling in this example?

In the above example, renters benefited from this price ceiling, as they are now able to secure an apartment for $200 cheaper.

Landlords are the clear losers in this example, as they now receive $200 less in revenue per month.

Moreover, real estate developers might no longer have an incentive to build new properties since the money they bring in might not cover expenses.

Keep in mind that landlords might be forced to cutback on certain services that were previously offered to the tenants to reflect the lack of operating income such as heat or building maintenance.

Problems involving a Price Ceiling

For a price ceiling to be effective in its intended purpose, it obviously must differ from the currently established price.

For example, if a ceiling price is imposed which is higher then the current price, then there is no practical effect, making the Ceiling useless.  This means that the government has dictated a maximum price, yet companies are currently selling the product below the ceiling.

Where this becomes an issue is on the opposite side, if the government set the price ceiling below the current market price.  Consider a product that currently sells for $50, and the government imposes a legal limit of $45.  Suppliers of the product are now legally forced to accept the lower prices, and sell the product for $5 below their target-selling price.  The incentive to sell the product at the reduced price is reduced as it cuts into their profit margins, and they might chose to discontinue production.  Consumers might then face a situation where there is a shortage of available products.

The government has put into place a legal maximum allowed price, but there are no laws preventing the supplier from completely scrapping the product, or changing their production quantities.

Moreover, suppliers of this product might be forced to reduce the quality of the product to compensate for their lost revenues.  The consumer suffers in the end, as they now are forced to purchase a lower quality product.

Conclusion

Price ceilings are normally imposed during periods of, or directly following economic hardship, famine or war.  The government needs to step in to establish a maximum price to prevent out of control increases in price.

Price ceilings are counter-productive in the sense that it dictates the maximum price that can be charged, while ignoring the price set by the market.

In the free market, buyers wish to minimize the price they are willing to pay, and sellers wish to maximize their revenues, hence both buyers and sellers compromise, and establish a price at which everyone is as satisfied as possible.

A price ceiling can have unintended consequence of ruining the free market by forcing suppliers to cut back on their product, produce inferior versions, or simply disband the product altogether.

Buyers now are faced with a potential shortage of the product and may even be forced to secure the product through illegal means, such as looking in to the black market.

Economists have a difficult time presenting a strong benefit to price ceilings, as a government imposed maximum price often goes against the free hand of the market.

“Greed is good, greed works.” These the famous words uttered by fictional corporate raider Gordon Gecko in the epic film ‘Wall Street.’ The 1980s was the decade of corporate raiding and Gecko’s mentality was an accurate depiction of the times on Wall Street.

Other well-known corporate raiders such as Carl Icahn and T. Boone Pickins went on raiding sprees, ruthlessly taking over companies with the intent of expelling the existing management, then doing whatever was necessary to generate a profit for themselves, at the expense of others.

How do Takeovers work?

You might wonder, how can this daunting task be accomplished? Takeover bids are attempts by a bidder (such as Carl Icahn) to obtain control of a “target” company.  Firstly, the raider must manipulate himself onto the Board of Directors.  This could be accomplished by purchasing a large position of the corporation’s available stock thus giving the bidder the opportunity to vote himself onto the Board.  Each share equals one vote in determining who the directors will be.  Soliciting proxies, which is a process of convincing existing shareholders to hand over their vote is another tactic that the raider might use for the purpose of appointing himself to the Board of Directors.

Once the raider (bidder) successfully places himself on the Board of Directors, the raider then has the ability to manage the target company or exert a significant amount of pressure and influence over the direction of the company, including selling off units and cutting the benefits of employees.

The invention of the “Poison Pill”

High profile mergers and acquisitions lawyer Martin Lipton developed the concept of “Poison Pill” in 1982 as a response to the increase of hostile takeovers and corporate raids.  Lipton is quoted as saying “The early 1980s we had reached a whole new plateau of hostile takeovers and there was really little in the way of defense to them”. The term itself is derived literally from the cyanide poison that a spy could ingest in order to commit suicide, rather than risk being captured and tortured.

The corporate version of the “Poison Pill” however was not meant to prevent a hostile take over.  It’s purpose, according to Lipton, was to give shareholders more time to evaluate the proposed hostile bid and to give management the opportunity to make a better informed business decision.  Two of the most common “Poison Pill” strategies include:

Flip-over:  Existing investors are given the opportunity to purchase the bidder’s shares at a premium.

Flip-in:  Existing investors are given the opportunity to purchase additional shares in the company at a premium.

Both strategies have a specific purpose of diluting the company’s stock, thus making a hostile takeover more expensive and less attractive.

Advantages and Disadvantages of the Poison Pill

A “Poison Pill” creates a strong defense mechanism for a “target company” allowing the company to properly identify legitimate and beneficial acquisitions and weed out the actions of corporate raiders.  The “Poison Pill” is also useful in slowing down the speed of potential raids.  The spin-off effects are quite positive and could result in higher premiums paid to shareholders, should an acquisition be favorable.

On the downside, the “Poison Pill” has the power to greatly reduce shareholder value.  For example, in 2008, Microsoft offered shareholders of Yahoo! $31 a share representing a 62% premium at the time, but quickly backed out after the effect of the “Poison Pill” defense proved to be too much to handle. This cost Yahoo! CEO and co-founder Jerry Yang his position as head of the company.  Yahoo! shares have not traded anywhere close to $30 since this proposal.

Unfortunately, a “Poison Pill” could also create inefficiencies in the system and harm not only the bidder but also the shareholder.  A purchaser who wishes to buy and an individual investor who wishes to sell are simply out of luck with both actions locked by the “Poison Pill.”  If anything, this undermines shareholders rights, rather than supporting them.

On the other hand, one might argue the following.  Consider that corporate raiders are skilled in the art of discovering intrinsic value hidden deep within the target company that is not apparent on its balance sheet nor in its current stock price.  A hostile takeover can present an opportunity to install fresh, qualified and dedicated management who are willing and able to guide the company in a brand new direction.

Conclusion

At the end, it is hard to say whether a poison pill is a good thing or a bad thing. It really needs to be analyzed on a case by case basis. All we know is that is is a useful tool to fend off a hostile takeover.

A straddle is an investment strategy that involves the purchase or sale of an option allowing the investor to profit regardless of the direction of movement of the underlying asset, usually a stock.

There are two straddle strategies, a long straddle and a short straddle.

How to create a Long Straddle position

A long straddle involves a long position, where an investor purchases both a call option and a put option.

The two options are bought having identical strike prices and identical expiration dates.

A profit is made if the underlying asset moves significantly from the strike price in either direction.

An investor would use a straddle strategy when the market is volatile, and the investor is unsure of the direction of a stock, but certain that a large price movement will occur in either direction.

Example of a Long Straddle Strategy

Imagine ABC is trading at $40 at the beginning June.

Earnings are set to be released at the beginning of July.

An investor has noticed in the past that the day following the release of financial results there were large movements in the stock.

An investor decides on a long straddle and places the following trades:

Buys a JUL 40 put costing $200.

Buys a JUL 40 call for $200.

The trade has cost the investor a total of $400 to enter both positions.

He can not lose more than this amount.

If ABC is trading at $50 at expiration, the JUL 40 put expires worthless, but the JUL 40 call expires in the money with an intrinsic value of $900.

The investor’s profit (or loss) is calculated by subtracting the intrinsic value from the initial investment = $900 – $400 = $300.

The investor has generated a $300 profit.

Suppose that on expiration, ABC has not moved as originally anticipated.

Both the call and put positions expire worthless and have no intrinsic value.

The investor’s profit (loss) is = $0-$400 = ($400).

The investor realizes a total loss when the stock closes on expiration date at exactly the strike price therefore having no intrinsic value.


How to create a Short Straddle position

A short straddle strategy involves simultaneously selling a put and a call of the same underlying security, having the same strike price and same expiration date.

Since the investor is selling options, their risk is theoretically unlimited.

Unlike a long straddle, an investor can expect a profit when there is little volatility.

As well, a short straddle does not provide an unlimited profit.

An investor gains when the stock closes on expiration date at the target price.

Both call and put options expire worthless but the investor profits the entire credit with the sale of both options.

Example of a Short Straddle strategy

Imagine ABC is trading at $80 at the beginning of the position in March.

–        An investor would sell a MAY 80 put for $400,

–        Sell a MAY 60 call for $200

Total credit received is $600

If ABC has strong buying activity for several weeks and climbs to $96 (20% gain), the MAY 80 put will expire worthless, but the MAY 40 call expires in the money, with an intrinsic value of $1200.

The investor’s profit (loss) is calculated as the difference between the initial net credit and the intrinsic value= $800- $1200 = ($400.)

The investor has lost $400 by entering this position.

Suppose the stock is still trading at $80 on the day of expiration.

The MAY 80 put and MAY 80 call options both have an intrinsic value of exactly 0.

Again, the investor’s profit is = $800 – $0 = $800.

A maximum potential profit exists when the stock closes exactly at the strike price.

Conclusion

A long straddle provides the potential for unlimited profit while the maximum loss is defined as the initial investment made.

This strategy differs from a short straddle where the maximum loss is in theory infinite.

Both strategies are used in opposite market conditions.  Investment houses normally restrict the use of short strangles to experienced investors because of the risk associated to it.

In order to execute these strategies you must receive special permission from your broker to perform naked writing of options.

Before attempting any of the strategies listed, it is best to create a “paper account” where you can experiment these strategies without any risk.

An oligopoly is characterized by a small number of sellers who dominate an entire market.

Like the more commonly heard of term ‘monopoly’, the term oligopoly is derived from the Greek words oligoi meaning ‘few’, and polein meaning ‘to sell.’

All of the firms who partake in an oligopoly are considered to be “very large in terms of profit, size and client base.

Each individual company’s actions affect the others.  These firms are in constant competition which each other and often marketing campaigns are created to directly the completion.

An oligopoly differs from a monopoly, as it is impossible for one company to exert significance power to dictate price.

Characteristics of companies that make up an Oligopoly

Competition amongst companies in an oligopoly tends to be fierce.

Emphasis is placed on volume (selling large amount of products at the cheapest price possible) since companies within an oligopoly usually offer similar products and services at similar price points.

As such, expensive marketing campaigns are a main focus of these companies, as this is usually one of the only ways to differentiate themselves from the competition.

Example of Oligopoly

As an example, consider the market for cellular phones in the United States.

There are four major players that account for approximately 90% of the total national cellular phone market.

These companies are:

  • Sprint-Nextel
  • T-Mobile
  • Verizon
  • AT&T

All four companies offer either identical products, or interchangeable substitutes.  As an example, all four carriers offer the Blackberry smart-phone, but the specific model varies from one company to the other.

A major characteristic of firms in an oligopoly industry is the various uses of “non-price competition.”  This form of competition focuses on strategies other than price in order to win customers and increase profits.

Consider a person who wishes to purchase a new cell phone (and has never owned one before.)

As discussed earlier, all four carriers offer very similar, if not identical cellular phones and plans.

This person is likely to take a trip to the local mall, where all four carriers each have a store.  After gathering information from all four and realizing that each carrier charges approximately the same amount for their monthly plans, this person is likely to make their final purchasing decision based on other factors, since price plays no role in their decision making.

These factors may be extraordinary customer service received at one store, extended store hours, or even basing the decision on a memorable and funny commercial that this person recalled.

The size and scope of the four competing companies at a national level also illustrates an advantage of oligopoly, as competition is greater when there are more firms operating at the same level.

Imagine if three of the cell companies were only regional carriers, operating in specific, pre-determined major metropolis cities in the United States, rather than a national level.

This would completely eliminate the oligopoly status of the industry, and it would now be by nature a monopoly for individuals living in rural lower populated areas that lack regional carriers.

Prices might increase and consumers will be paying more compared to clients on a national network.

Conclusion
The constant but not perfect competition in an oligopoly leads to a semi-favorable outcome for the consumers, as prices are kept lower than a monopoly, but not as low as in perfect competition.

A perfect competition exists when no one company, is strong enough on its own to set it’s own terms and conditions on the market.

In an oligopoly, the main players have an incentive to collude and keep prices higher as high prices translate to higher revenue for all the players.

The word ‘monopoly’ is derived from the Greek words monos (single) and polein (to sell).

Monopoly, in economic terms, is used to refer to a specific company or individual has a large enough control of a particular product or service that allows them to influence it’s price or certain characteristics.

Henry Ford, founder of Ford Motors had the following to say regarding his products: “Any customer can have a car painted any color that he wants so long as it is black.”  Ford Motors held a monopoly in the automobile market, as they were the only automobile company that consumers can purchase from in the early 1900s.


What it takes to be a Monopoly

Monopolies by definition exist when there is a lack of competition to produce a good or service, as well a lack of an alternative solution for the consumer.

A Monopoly must satisfy the following criteria:

  • Single seller:  In a monopoly, there can only be one seller, which is responsible for producing 100% of total output of the given product.
  • Market power: A company that holds a monopoly has the ability to change the price of the product whenever they feel is necessary.  The absence of competition forces consumers to accept the new price since there is no alternative.
  • Firm and industry: A company that retains a monopoly is considered to be itself the industry.  This means that the firm constitutes and represents the characteristics of the industry.  Think of it this way:  Total demand for the monopolistic company’s products equals the total demand for the entire industry.


Sources of monopoly

In theory, holding a monopoly sounds lucrative, profitable and a source of power.

In fact, it is extremely difficult to achieve monopolistic status, or to compete with a monopoly.

There are circumstances that impede or greatly prevent a company from achieving a monopoly.  Several examples of barriers for a new company to enter and steal market share from the monopoly:

  • Capital requirements: Extremely large up front fixed costs often make it difficult for a new firm to enter the market and challenge the dominance of the monopoly.
  • Technological superiority: A monopoly that has existed for a long time has the resources, personnel and knowledge to make use of the most up-to-date and efficient technology.  Having this superiority allows the monopoly to produce products at a cheaper price and more efficiently than a small firm would be able to.
  • Legal barriers: A government may operate a monopoly (such as electricity) and thus make it illegal for other.
  • Control of Natural Resources:  A monopoly controls resources that are vital to the production of the final good.


Example of a Monopoly (and its failure)

You might remember Microsoft was under the international microscope for operating as a monopoly in 1998.

The logic behind this argument was that the Microsoft web browser was pre-loaded on all Windows operated computers for free.

Competing web browsers such as Netscape (remember them?) and Opera would take a long time to download at dial-up speeds.  These browsers were also available for purchase in a store for a high price.

These two aspects made it unrealistic for a consumer to use a browser other then Microsoft.

Regardless, a United State Judge concluded that Microsoft is indeed a monopoly.  With the support of 240 economists, Microsoft had made the following argument which appeared in major newspapers as their defense:   “Consumers did not ask for these antitrust actions — rival business firms did. Consumers of high technology have enjoyed falling prices, expanding outputs, and a breathtaking array of new products and innovations.”

Today, Microsoft has been overtaken by Apple in terms of market size and innovation.

This goes to show that a monopoly can not last forever, and it is possible for a much smaller company to challenge the monopoly and steal market share.

Monopolistic Competition is characterized as a form of imperfect competition.

An imperfect competition exists when there are many sellers of a good or service but the products do not contain noticeable differences.  There are several forms of imperfect competition, of which Monopolistic Competition is one.

To best explain this, let us think of shoes as a perfect example.  Nike, Adidas, Reebok and many other brands all sell basketball shoes at approximately the same price.  The only aspect that differs from one to the other is negligible.

Companies in the Monopolistic Competition place an emphasis on “non price differences” to promote their products, such as endorsements from NBA superstars.  Los Angeles Lakers superstar Kobe Bryant endorses and wears Nike, while Orlando Magic superstar Dwight Howard endorses and wears Adidas.

Therefore, a Monopolistic Competition exists when there are many producers selling similar products to many consumers in a given market and no one company has total control and dominance.


Advantages of Monopolistic Competition

Perhaps the greatest advantage for consumers who wish to make a purchase from a Monopolistic Competition industry is the access to information.

Taking the previous example relating to basketball shoes, a consumer can easily browse the manufacturer’s website to gather information, or read reviews from Consumer Reports or by performing an internet search.

Consumers can also try on the shoes at the store and evaluate the comfort level for themselves before making a purchase.

Products in a Monopolistic Competition are differentiated through distinctive features and other promotional techniques.

For example, Kobe Bryant shoes offered by Nike are the only shoes in the market containing the purple and gold colors representative of the Laker’s uniform.

Another advantage available to consumers is the factor of availability.  Amazon, an online retailer for books, DVDs and other consumer goods differentiate themselves by offering the possibility to order online and have the products mailed to the consumer. A book available on Amazon sells for approximately the same price as a book in a brick and mortar store, such as Barnes and Nobles.


Disadvantages of Monopolistic Competition

A disadvantage in a Monopolistic Competition is the concerns that the perceived “prestige” of the brands induces consumers into spending more on the product.  This means that the name associated with the product rather than the actual benefits are the driving factor in consumers potentially over paying.

In a monopoly (only one seller of a product) the consumer is faced with one choice from one company.  Information gathering for a purchase is straightforward, and the consumer is left with no choice regarding the purchase and is forced to accept the price.

In a Monopolistic Competition, since the brands are virtually identical (recall the shoe example – a Nike pair of basketball shoes provides the same usage as Adidas) consumers must now collect and process information on a large number of different products from all different brands, keeping in mind that each manufacturer sells many different models. The total choices for shoes can be in the dozens!

Economists can argue the fact that in many cases, the cost of gathering information (time, effort, headaches) exceeds the benefit from the consumption of the brand.

Conclusion

As previously stated, a monopoly exists when there is only one supplier of a product with a lack of alternatives.

A Monopolistically Competitive Industry provides the consumer with many choices; however the difference from one company to the other is negligible.

Consider another example as toothpaste.  Most consumers can not differentiate between the Colgate brand and Crest.  A consumer that does not enjoy the taste of one, is left with little alternative.

One can make the argument that a Monopolistic Competition can be considered a form of monopoly since alternative choices do theoretically exist, are the products really that much different?

Money supply is the total amount of money available in an economy at any particular point in time.

Money is required for both consumers and businesses to make purchases.

Money is defined as currency in circulation and demand deposits (funds held in bank accounts.)

Different types of money in supply

Money is classified (as “M”) into different categories ranging from M0 to M3 and with few exceptions these categories are similar worldwide.

  • M0 money supply refers to: physical currency, that is actual dollar bills and coins that individuals keep in their wallets (or hidden under the mattress!)
  • M1 money supply refers to: M0 + funds in deposit at banking institutions.
  • M2 money supply refers to: M0 + M1 + small time deposits (deposits of less than $100,000 that can not be redeemed before a certain date.)
  • M3 money supply refers to: M0+ M1 +M2 + large time deposits (deposits exceeding $100,000 that can not be redeemed before a certain date) + large liquid assets (example, stocks) + short term repurchase agreements (a form of short term investment) + institutional money-market funds (mutual fund that invests in short term debt)

Importance of Money Supply relating to Inflation

Money supply is important because it is directly linked to inflation.  A country whose money supply increases rapidly will experience inflation.

A prime example of this is Zimbabwe, which has seen inflation increase in the tens of thousands percent because the government continuously printed large amounts of money.

In fact, a one hundred trillion dollar Zimbabwe bank note can be purchased on EBay for less than US$1, because even that has lost all value as the government continued to print new money.

The money supply data is not exactly a short term “market mover” because it is reported very frequently. In the United States money supply data is published weekly and often the change from one week to the next is minimal.

The data is used by economists and investors as there are complex relationships between money supply and GDP growth as well as inflation.

Historically the money supply tends to rise faster during periods of economic expansion.

Investors who closely monitor the money supply data can take this opportunity to buy stocks.

Conclusion

Perhaps the most important of the “M” figures is M2, which represents cash and cash equivalents.  These funds are considered to be liquid in the sense that all holdings can easily be converted to cash if need be.

While growth in the M2 money supply does not directly indicate future spending, it can be an indication that inflation is a possibility.

A good comprehension of economics and money supply is beneficial should the M2 supply outpace economic growth, resulting in the fact that more money is now “chasing” after the same amount of goods.

Modern Portfolio Theory (MPT) is an investment theory whose purpose is to maximize a portfolio’s expected return by altering and selecting the proportions of the various assets in the portfolio.

It explains how to find the best possible diversification.

If investors are presented with two portfolios of equal value that offer the same expected return, MPT explains how the investor will prefer and should select the less risky one.

Investors assume additional risk only when faced with the prospect of additional return.

In brief, MPT explains how investors can reduce overall risk by holding a diversified portfolio of assets.

Assumptions of MPT

• Asset returns are normally distributed random variables.
• Investors attempt to maximize economic market returns.
• Investors are rational and avoid risk when possible.
• Investors all have access to the same sources of information for investment decisions.
• Investors share similar views on expected returns.
• Taxes and brokerage commissions are not considered.
• Investors are not large enough players in the market to influence the price.
• Investors have unlimited access to borrow (and lend) money at the risk free rate.

Efficient Frontier

• One of the most important and widely used concept of Modern Portfolio Theory
• Every possible combination of assets plotted on graph.
• Plots return % vs Risk % (Standard Deviation)
• Optimal portfolio lies on the efficient frontier curve (parabola).

• All individual assets represented by gold dots are plotted inside the efficient frontier.

• The “tangency portfolio” represented by the red dot represents the most efficient combination of assets.
• The diagonal line represents a “risk free” asset- An asset that has a guaranteed return.

• The CAL (Capital Allocation Line) displays the return an investor should make by taking on a variable level of risk.

Limitations of Modern Portfolio Theory

Modern Portfolio Theory takes in to account many assumptions which are not always correct in the real world. As an example, the theory assumes that asset returns are normally distributed random variables. A real life examination indicates this is often far from true.

In many cases there are many large swings which invalidates the theory. Another major flaw in the theory relates to the assumption that all investors have access to the same information.

This is far from true. Many online publications such as Wall Street Journal or Bloomberg charge members to access their sites. Investors who do not pay an additional fee can be left in the dark when it comes to news.

As always, as an investor it is best to never jump to one conclusion based on one theory. An overall analysis should include much more information than just an efficient frontier.

Key Words: Modern Portfolio Theory, Expected Return, Diversification, Risk, Normally Distributed Variables, Rational Investors, Efficient Frontier, Risky Asset, Risk Free, Capital Allocation Line,

The Expected Return is a weighted-average outcome used by portfolio managers and investors to calculate the value of an individual stock, or an entire stock portfolio.

Expected Return of an individual stock

A stock analyst has conducted a thorough amount of research on company XYZ and has come up with the following conclusion:  XYZ could experience on of the following outcomes:

1. Rise 15%

2. Rise 25%

3. Fall 5%

The analyst has also concluded that:

  • Scenario 1 has a 55% of occurring
  • Scenario 2 has a 35% chance of occurring
  • Scenario 3 has a 10% chance of occurring

Using the above information, the stock analyst can make a more accurate prediction using all three scenarios in a weighted average to calculate the “Expected Return” as follows:

where:

E[R] = Expected return of the stock

N= Number of scenarios

Pi= Probability of state i

Ri= Return of the stock in state i.

In simpler terms, Expected Return is equal to the sum of all the different outcomes calculated by multiplying the probability of each individual given return by their corresponding probability.

In our example:

E[R] = (0.15*55%) + (0.25*35%) + (-0.05*10%) = 0.0825+0.0875-0.005 = 0.165

Based on using all the given scenarios, the stock analyst has concluded that XYZ has expected return of 16.5%.

Expected Return of a Portfolio

After a prudent analysis of all stocks in a client’s portfolio, the stock analyst has come up with the expected return of individual US equities, as well as the weight of each asset (that is, the share of each asset in the portfolio) which is summarized below:

StockExpected ReturnWeight of stock in total portfolio
Apple Corp (AAPL)-6%15%
Wal-Mart (WMT)18%20%
Google (GOOG)29%35%
Amazon.com (AMZN)-16%10%
Exxon Mobile (XOM)3%20%
  Total = 100%

Expected Return of portfolio is computed as follows:

Where

E(Rp) = Expected return on the portfolio

Ri = Return on asset i

Wi= Weighting of component of asset i

In simpler terms, Expected Return of Portfolio = Sum of all Returns multiplied by their individual weights

E(Rp) = (-0.06*15%) + (0.18*20%) + (0.29*35%) + (-0.16*10%) + (0.03*20%) = -0.009 + 0.036 + 0.1015 – 0.016 + 0.006 = 0.1185

Based on the given returns and weighting of each stock, the portfolio manager has concluded that the portfolio has an expected return of 11.85%

Conclusion

Expected Return provides a mathematical answer when combining all the given scenarios of a stock (or portfolio) performance.

The actual return of a stock may be one of the given scenarios, but it is also possible that the actual return will not be close to a predicted scenario.

Portfolio managers and investors need to closely keep track of all assets owned and take immediate action when required.

An investor might consider selling an asset if it exceeds the Expected Return, or if the Expected Return is disappointing.

If a stock is declining but an investor is confident in his analysis, then it might present a good opportunity to purchase additional shares, to hopefully make some money in the future.

A Portfolio Manager is a professional investment adviser who manages his clients’ assets.

A Portfolio Manager is expected to keep a watchful eye on all his client’s investments and take corrective measures when appropriate should the market turn in the wrong direction resulting in a decrease of the total value of the portfolio.

How to evaluate a Portfolio Manager

A portfolio manager must meet two conditions:

  1. He/ She should be registered with an investment authority
  2. He/ She should be certified to act as a manager

A portfolio manager might not necessarily have an educational background in finance or accounting, but certifications in the field of investment (such as the Chartered Analyst (CFA) program) are good to have.

A portfolio manager working on behalf of a bank or an internationally recognized firm such as Merrill Lynch has access to investment products that independent advisors do not.

It is important to include this information in your analysis of an advisor.

A good way to evaluate a manager is to ask many relevant questions pertaining to your own personal financial situation and your financial goals.  Examples of questions to ask are:

  • How often will I receive communicate from you?
  • How often will you make or suggest changes to my stock portfolio?
  • How many clients do you have? Will you be too busy to fully take care of my needs? Do you understand the needs of clients in my financial situation?
  • Is there a minimum amount that I am required to deposit in order to invest?
  • What is your commission structure? Are there any fees that I should be aware of?
  • Who audits your firm’s financial activities?
  • How long have you been with your current employer and what happens if you leave organizations? Will my fund be transferred, or will I be assigned a new investor?
  • Are there any fees or penalties if I pull out my money?

Questioning the portfolio manager’s specific knowledge of investment management is also important to make sure you are dealing with an individual who has enough knowledge of the market to suit your needs.

More qualified managers are able to answer questions in a more confident and informed way, such as:

  • How often will you perform an efficient frontier analysis (advanced theory of portfolio analysis) of my portfolio?
  • What do you envision the beta and expected return for my portfolio?
  • What was the worst performing stock you purchased for your clients and what did you do about it?  How did you remedy the situation? How have you changed your strategies based on this occurrence?
  • If I am not satisfied what are some “exit routes”?
  • Do you offer the opportunity to hedge my portfolio with options?
  • What are your short and long term views of currency fluctuation relating to my personal portfolio?

Conclusion

When evaluating a prospective Portfolio Manager it is important to understand their investment philosophy and make sure that it meshes well with your financial situation and objective.

A Portfolio Manager who believes in speculative investments and penny stocks might not suitable for a client who is close to retirement and requires stability.

Portfolio Managers who partake in activities outside of work relating to investments, such as writing an opinion column for a newspaper, hosting a radio show or leading financial workshops and seminars demonstrate that they have a firm, real-world understanding of investing, and would hopefully be able to manage your investments in a professional, successful manner.

Selecting an investment manager active in many forms of communication will allow a client to gain a more detailed and complete understanding of the manager’s philosophy and personality to determine if the client will feel comfortable in the relationship.

Elasticity is one of the most important terms in economics, and has a plethora of uses.  Economists define elasticity as the ratio of the percent change in one variable to the percent change in another valuable.

Its purpose is to measure how one variable responds to changes in another variable.

As an example, consider a company that sells 100 units of a product for $20 each. Elasticity is used to explain what will happen to sales, if the price of the product is increased to $21 a unit.

An “Elastic” variable is when a variable (sales of the newly priced unit) responds “a lot” to small changes in the other parameter (price.)

Contrary, an “inelastic” variable is when a variable (again, sales) responds “very little” to changes in the other parameter (price).

This article will showcase examples to illustrate the formulas provided.

Price Elasticity of demand

Price elasticity of demand measures the change in percentage of demand caused by a percent change in price.

If the elasticity is between 0-1, demand is said to be inelastic (little change).

Greater than 1, demand is said to be elastic (great change).

As a note, it is common that the formula will yield a negative value, thus we concern ourselves with its positive value (i.e absolute value).

Elasticity (Ed) can be calculated as follows:

% change in quantity demanded
Ed  = __________________________
% change in price

Example: A company has conducted a survey that indicates consumer responses to a hypothetical increase in their price.  The company has discovered that if the price is increased from $100 to $106 (representing a 6% change), the quantity demanded will decrease by 8% (from 100 units sold to 92 units.)

Ed = (-8% / 6%) = -1.33

Since 1.33 is greater than 1, we can conclude that the demand is elastic, meaning that the change in demand caused by the change in price is considered “a lot.”

We can also calculate the effect of the change on price on revenue to get another view of what the Elasticity of demand means:

Old price, total revenue = 100 units sold at $100 = $10,000

New price, total revenue = 92 units sold at $106 = $9,752

Income Elasticity of Demand

Income elasticity of demand (IEOd) measures the response of a given good to a change in the income of its existing clients.  It is calculated as follows:

% change in quantity demanded
IEOd  =  _____________________
% change in real income

Example:  A company has conducted marketing surveys and discovered that if a consumer group’s income increases by 15%, the demand for the given good increases by 25%.
25%
IEOd = _____   = 1.66
15%

A negative Income Elasticity of Demand is generally associated with “inferior goods.”  The increase in income results in a decrease in demand for these products that are deemed to be of an inferior quality.  Examples of such products may be bus services, hamburger meat or generic brand soda.  When income rises, the consumer may opt to purchase an automobile, steak, and brand name cola, since they can now afford these extra luxuries.

A positive Income Elasticity of Demand is associated with “normal goods.”  An increase in income will lead to an increase in demand, for example tobacco has been calculated to have an elasticity of demand of 0.64.  An elasticity of greater than 1 is considered a “luxury good” for example a Mercedes Benz automobile or an Armani suit

A zero income elasticity occurs when an increase in income does not associate with a change in the demand for a good.  For example these are products that are essential to live, such as fresh vegetables and milk.

Conclusion

Elasticity is a widely used economic theory that has an extremely large range of uses and applications.  Other examples of how elasticity is used include its effect on international trade, analysis of advertising on consumer demand and analysis of future consumption patters.

If you own a bond or manage a bond portfolio, chances are that will you be following daily interest rates. You know that bond prices increase when rates rise, and decrease when rates fall. But how do you measure the bond’s price sensitivity to such rate fluctuations? The answer is duration.

Duration measures the percentage change in the price of a bond (or value of a bond portfolio) due to a change in market interest rates (also known as the yield).

Originally developed by Frederick Macaulay in 1938, it has become the standard measure of interest rate risk amongst practitioners in the fixed-income portfolio management profession, and has evolved into several variations used in the industry. Duration also plays an important role in bond immunization strategies.

Duration measures include Macaulay Duration, Modified Duration, Key Rate Duration, and Effective Duration.

Macaulay Duration

Being the first duration measure developed, it was defined by Frederick Macaulay as the present value of the weighted average term to maturity of cash flows from a bond, and as such was interpreted in temporal terms (number of years).

Formula

Macaulay Duration


Where,

 n      =     frequency of Coupon Payments
t       =       time to maturity
C      =     Coupon Payment
y      =     required yield
M     =    Maturity (or Par) Value
P      =    Bond’s Price

Note that the denominator in the above equation is the formula for determining the present value or price (P) of the bond.

Example

Assume a 5-Year bond paying a 6% annual coupon, and yielding 5%.Using the formula above, the bond’s Macaulay duration can be calculated as:

Macaulay-Duration-Example

Modified Duration

Essentially an extension of Macaulay duration, modified duration is the predominant duration measure used in the fixed income industry, and is defined as the % price change (or price-sensitivity) of a bond to a 100 basis point change in yield.

Formula

Modified Duration

where,

V0 = Bond’s Initial Price
V+ = Bond’s price if yields decrease by
V = Bond’s price if yields increase by
= Change in yield (expressed in decimal)
YTM = Yield to Maturity (or Yield)

Example

To illustrate its calculation, a hypothetical bond will be used:

Term to Maturity

10

Coupon Rate (annual)

9%

Yield

6%

Face Value

$100

Initial Bond Price

$122.08

If we assume a 20 basis point change in yield modified duration can be calculated as:

Modified-Duration002
Modified-Duration003


Remember that this is the % price change for a 100 bps change in yield. Next, we show how to use this result to estimate the % price change for a yield shift of any magnitude.

Formula and Example for Estimating % Price Change Using Modified Duration

Modified-Duration004

For example, assume that the yield for the bond above shifts from 6% to 8% (an increase of 200 basis points):

Modified-Duration005

Therefore, a 200 bps increase in the yield will cause the price of the bond to approximately drop by 13.8%

Limitations of Modified Duration

We can see the first limitation of modified duration with the following graph:

Large shifts in yield will cause modified duration to be significantly inaccurate. Moreover, duration (as represented by the tangent line above), will underestimate bond prices with respect to yield shifts.

Another disadvantage is that modified duration does not account for option-embedded features in certain fixed-income securities (e.g., convertible bonds or mortgage-backed securities) which may cause future cash flows to change with shifts in yields.

Key-Rate Duration

Key-Rate Duration is computationally similar to Modified Duration, except that it accounts for non-parallel shifts in the yield curve. For example, the magnitude of a yield shift will differ for a 1-Year treasury compared to a 10 Year bond. Using key rate duration, we can assume non-parallel yield shifts across different maturities, thus obtaining a more accurate (and realistic) measure of interest rate exposure to a bond portfolio.

Effective Duration

This duration measure accounts for the embedded option features in certain fixed-income securities such as convertible securities or mortgage-backed securities, whose future cash flows could change with shifts in interest rates.

Conclusion

Duration measures the price-sensitivity of bonds due to changes in interest rates. It plays an important role in managing interest rate risk exposure. However, due to convexity issues, care must be taken when interpreting its results when assuming large shifts in the yield. Furthermore, when dealing with option-embedded bonds or an assumption of non-parallel yield shifts, effective duration and key-rate duration can provide better estimates of price sensitivity.

Key Words: Duration, Macaulay, Modified, Key Rate, Bond, Fixed-Income, Interest, Rate, Risk, Exposure, Yield, Term to Maturity, Coupon, Face Value, Principal, Price, Sensitivity, Percentage, Shift, Basis Points, Convexity

Dupont Analysis breaks the Return on Equity into several different components in order to analyze where the returns are coming from.

Return on Equity (ROE) is one of the most important pieces of data that investors and creditors use to evaluate a company’s potential to grow and profitability.

ROE is typically calculated as net income divided by shareholder’s equity.

The company’s net income can be found on the income statement, while shareholder’s equity is found on the balance sheet.

ROE reveals how much profit a company has generated using the cash that shareholder’s have invested in the company.  In the 1920s,

DuPont Corporation, one of the world’s largest chemical companies, developed a twist on ROE and breaks it further down in to three components: net profit margin, asset turnover and the equity multiplier.

DuPont Formula

The DuPont Model is calculated by multiplying all three components as follows:

DuPont Return on Equity = (Net Profit Margin) * (Asset Turnover) * (Equity Multiplier)

Net Profit Margin

The net profit margin is the after tax profit a company generates for each dollar of revenue.

A higher net profit margin is usually preferable as this indicates that the company is able to generate a higher profit per dollar.

Net profit margin is calculated using the income statement as follows:

Net Profit Margin = Net Income / Revenue

Asset Turnover

The asset turnover ratio is a measure of how effective a company is in converting its assets into sales.

A higher ratio indicates that the company is able to better make use of assets in generating cash from sales.

The ratio is calculated as:

Asset Turnover = Revenue / Assets

Equity Multiplier

The equity multiplier is a tool to analyze what portion of the ROE is a result of debt.

It is possible for a company in terrible position sales wise to artificially increase its ROE by taking large amounts of debt.

A higher ratio indicates that the company is relying for a large part on borrowing money to finance the purchase of assets.

The equity multiplier is calculated as follows:

Equity Multiplier = Assets / Shareholder’s Equity.


Example of DuPont Model

Using data collected from Google’s investor relations site (investor.google.com) we are able to gather the following necessary information (in thousands of dollars) for Google’s year-end data 2010:

Total Revenue: $29,321,000

Net Income: $8,505,000

Total Assets: $57,851,000

Shareholder’s Equity: $46,241,000

Net Profit Margin: Net Income ($8,505,000) ÷ Revenue ($29,321,000) = 0.29

Asset Turnover: Revenue ($29,321,000) ÷ Assets ($57,851,000) = 0.507

Equity Multiplier: Assets ($57,851,000) ÷ Shareholder’s Equity ($46,241,000) = 1.251

Finally, The DuPont Model is calculated as [0.29*0.507*1.251] = 0.2068, or 20.68%

Results of DuPont Example

A 20.68% ROE is a good indication of Google’s ability to generate profit.

Stock analysts can use the DuPont Model to make a side by side comparison of two companies in a similar industry with a similar ROE.

Breaking down ROE in to three categories is especially useful in this situation.

If we were to calculate the ROE of Google without the equity multiplier, we would see how much they have earned if it was completely debt free.

In this case, the ROE would be = 0.29*0.507=0.147 or 14.7%.

This indicated that in the year 2010, 14.7% of the ROE was generated from sales, while 5.98% was due to returns earned as a result of borrowing money to finance activities.

When evaluating two companies, the more favorable of the two would obviously be the company with a higher percentage of internally-generated sales.

The Direxion Small Cap Bear 3x is a triple-leveraged ETF offered by Direxion Investments that seeks to negatively triple the returns of the Russell 2000 stock index.

About

All Direxion ETFs work on a daily timeframe; the TZA ETF’s goal is to give -300% of the return of the small-cap stocks featured in the Russell 2000; this does not mean it will negatively triple the returns over a month or over a year. For example, this particular ETF has lost about 95% of its value since inception because this index has gone up over that time frame. However, if you were to day trade, it may have still been possible to make money with TZA.

Related ETFs

  • TNA: The Direxion Daily Small Cap Bull 3x, provides approximately the opposite returns of the TZA
  • LLSC: Another Russell 2000 leveraged ETF, leveraged at 1.25x
  • SMLL: Another Russell 2000 leveraged ETF, leveraged at 2x

Straight line depreciation is the most commonly used and simplest form of depreciation. To calculate straight line depreciation, start with the purchase or acquisition price of an asset and subtract the salvage value. Then you divide by the total productive years the item/asset can be expected to be useful to the company. The expected life of an asset is called its “useful life” in accounting jargon.

Straight Line Depreciation Calculation
(Purchase Price of Asset – Approximate Salvage Value) ÷ Estimated Useful Life of Asset

Example of Straight Line Depreciation:

Lets say we buy a computer for your business at a cost of $5,000.  As of today, you can expect to sell it when it is no longer useful (salvage value) at around $200. Federal accounting rules allow computers to have a maximum life of five years. In the past, your company has upgraded computers at least every three years. Since the shorter period is more realistic and it allows you to take a bigger tax deduction, you choose 3 years for the useful life. Using that information, you would plug it into the formula:

($5,000 purchase price – $200 approximate salvage value) ÷ 3 years estimated useful life

Therefore, your business can take a depreciation charge of $1,600 annually for three years if you were using the straight line method.

Depreciation (also known as amortization) refers to the gradual and permanent decrease in value of the assets (referred to as a depreciatable asset) of a firm, nation or individual over its lifetime.

An asset can depreciate for many reasons such as due to wear and tear or it has become obsolete.

Depreciation is a necessary concept because as a company buys a fixed asset (such as new equipment), management expects the asset to be useful and generate the necessary revenues over time.

Another reason for depreciation is that without it, fixed assets in the balance sheet will be overstated.  For example the market value of a 5-year-old piece of equipment is not worth the same as when it was purchased brand new.


How to calculate Depreciation

In order to calculate depreciation, four values are needed:

(i)                Initial cost of the asset;

(ii)               Expected salvage value of the asset (which refers to the value of the asset when it can no longer be used in production.  For example, an asset can be sold for spare parts or metallic contents after it is retired from its original function.)

(iii)             Estimated useful life of the asset;

(iv)             A specific method of apportioning the cost of over the life (which will de discussed below).


Different types of Depreciation Methods

(a) Straight Line Depreciation

Straight line depreciation is the most often used technique and also the simplest.

The owner of the asset estimates the salvage value of the asset at the end of its useful life and expenses a portion of the original cost in equal proportions over that period and is calculated as follows:

For example, a Pizzeria purchases a new oven that is expected to perform at an optimal level for 8 years, for a cost of $8,000.  After the 8 years, the oven can be sold for spare parts for $750.

Annual Depreciation Expense =         ($8,000 – $750) / 8 years = $906.25

The depreciation figure implies that the book value of the oven as represented in the fixed assets portion of the balance sheet loses $906.25 in value each year.

After 1 year, the owner of the Pizzeria would list the oven has having a value of $8,000-$906.25 = $7093.75.

The second year it would be $ 8000 – (2 x $906.25) = $6,187.50, and so on.

(b) Declining-Balance Method

A Declining-Balance Method is an accelerated depreciation method and implies that the asset loses the majority of its value in the first few years of its useful life, since most assets perform optimally in the first few years.

The salvage value is not used in the calculation, as the Declining Balance Method assumes that the depreciation value at the end of the life is higher than the salvage value.

The annual depreciation rate is calculated as:

Annual Depreciation = Previous year’s value

For example, the same Pizzeria has expanded its business and now offers a delivery service.

The owner brought a brand new car for $20,000, and expects to use the car for 5 years before being replaced.  The asset depreciates by a factor of 1/N as follows:

YearDepreciationYear –end Value
1[$20,000/5]=$4,000$20,000-$4,000=$16,000
2[$16,000/5]=$3,200$16,000-$3,200=$12,800
3[$12,800/5]=$2,560$12,800-$2,560=$10,240
4[$10,240/5]=$2,048$10,240-$2,048=$8,192
5[$8,192/5]=$1638.4$8,192-$1638.4=$6553.6


(c) Activity Depreciation

Activity Depreciation is based on level of activity rather than time.

When the asset is originally purchased, its lifetime use is estimated in terms of the level of activity.

Returning to the Pizzeria example, the owner assumes that their delivery car will be used for 60,000 miles, and can be sold for spare parts for $1,000.

The per-mile depreciation rate is calculated as:

Depreciation per mile = (Cost – Salvage) / Total miles

Depreciation per mile = ($20,000 – $1,000) / 60,000 miles = $0.316 per mile

If after 1 year, the car has been used for 13,000 miles the car would have depreciated by:

$0.316*13,000 = $4,108

Thus, having a book value of:

($20,000 – $1,000 – $4,108) = $14,892. 


Conclusion

The proper use of conservative and accurate depreciation rates are of concern to a company’s management.

Different accounting rules allow assets to be written off over different periods of time, and at different rates.

A public company should explain clearly which depreciation method is used in the company’s annual 10K filling (annual report of a company’s performance), as different depreciation methods result in large differences.

Key Words: Depreciation, Asset, Equipment, Salvage value, Straight line depreciation, Declining balance depreciation, Activity depreciation, 10-K report

The consumer price index (CPI) is simply an indicator of changes in prices of goods and services experienced by consumers in a given country over time. The CPI in the United States is defined by the Bureau of Labor Statistics as “a measure of the average change over time in the prices paid by urban consumers for a market basket of consumer goods and services.”

The CPI is a statistical estimate using the prices of sample items whose prices are collected on a regular basis. Sub-indexes and sub-sub-indexes are computed for different categories and sub-categories of goods and services.  The annual percentage change in CPI is used to measure inflation. The CPI can be used to index the value of wages, salaries, pensions, and for regulating prices to show changes in real values. In most countries, the CPI is, along with the population census and the USA National Income and Product Accounts, one of the most closely watched national economic statistics.

The CPI is calculated at fixed intervals, usually monthly or quarterly, and is obtained by comparing the current cost of a “basket” of products to the prices seen in the past.

The products that make up a specific basket remain constant and do not change from year to year. The items that can be found in the basket are diverse, and include products as varied as garlic bread, frozen burgers, bananas, jeans, paint, dining room furniture, dishwasher tablets, DVD players etc.

The CPI is calculated as a percentage change from the base year (established in different years in different countries) when the first finding was established, and by default given a value of 100 (example will appear below.)

The CPI is sub-indexed into many categories such as Housing, Food and Beverage, Medical Care, Apparel and Entertainment for example.

What Data is needed?

Two types of data are needed in order to calculate the CPI.

  1. The first aspect is related to the price of all items in the basket,
  2. The second being weighting data, that is, what percentage of each item will be represented in the findings (for example, milk and bread is purchased more often than jeans, and as such should have a higher representation in the data.)

The price component is tabulated by taking a sample of goods and services from several different geographical regions, over several timeframes.

This is usually obtained by calling business owner to survey their prices.

Sounds complicated?  Think of it this way: it is impossible to tabulate the price of every apple sold at every grocery store in a country every day.

To simplify, the CPI simply takes a sample, which is believed to be statistically significant and representative of the entire country.

How do we determine the second aspect of the data?

The ‘weights’ of the items are typically based on results from surveys that are distributed to households.  The key is that the sample of consumers is random (where every single resident of the country has an equal chance of being included in the survey).

Thus, in our sample, we should have a mix of people from all different walks of life, and their answers put together should give us the ‘average’ consumer.

From here, we can have an excellent basis for the ‘weights’ of the products in the basket.

How is it calculated?

As previously mentioned, we need to remember that the base year was valued at 100.  We use this as a stepping-stone in our calculations.  Suppose that in the first year, economists tabulate spending habits:

15% of income is spent on food; the average value is $5,000

45% of income is spent on housing; the average value is  $15,000

10% of income on entertainment/leisure; the average value is $3,000

30% of income on everything else; the average value is $6,000

Base CPI = 0.15*$5,000 + 0.45*$15,000 + 0.10*$3,000 + 0.30*$6,000 = 9,600.

Note that 9,600 is just a number and is not a dollar value.  It is simply an index that will be used as a base to determine the change in the CPI over subsequent periods.  Since we are in

the first year our value of 9,600 is set to 100, because of the ease of understanding a base of 100 compared to a base of 9,600.

Let us assume that 20 years as passed, and the new data collected are as follows:

15% of income spent on food; the average value is $7,000

45% of income spent on housing; $21,000

10% of income on entertainment/leisure; $4,000

30% of income on everything else; the average value is  $8,000

Current CPI = 0.15*$7,000 + 0.45*$21,000 + 0.10*$4,000 + 0.30*$8,000 = 13,300

From this data, we are able to calculate our CPI increase by using the formula:

Current CPI                        13,300

CPI Increase =     __________________  =    ———–  = 1.3854

Base Year CPI                      9,600

New CPI Number = 100%*1.3854 = 138.54

Conclusion

The CPI is the most widely used indicator of price changes in many countries, and as such, it directly or indirectly affects every citizen of a country.

How is this the case? Consider a government that grants old age security pension and other welfare payments.  Proper tracking of the CPI allows the government to know how much to increase payments respectively due to an increase in the CPI.

Economists, marketing, executives and investors can all benefit from following the CPI closely to monitor trends in consumer spending and can use this data to their benefit.

For example, an investor might notice that the sub index of food is increasing at a consistent base, so it may be an indication to invest in a grocery chain by buying its stock.

As with every economic indicators, there are limitations.  The CPI does not take into account changes in taxes, educational quality, health care, air and water quality, crime levels and many other factors.  The CPI is still a widely used price index to measure spending trends and its effect on the economy.

Key Words: Consumer Price Index, Price, Spending, Income, Government, Economists

A basic material used in manufacturing or commerce that is interchangeable with other the same commodities coming from a different source.  The quality of a specific commodity may differ slightly, but it is essentially uniform across producers. When they are traded on an exchange, commodities must also meet specified minimum standards, also known as a basis grade.  Typical types of commodities are corn, gold, oranges, wheat, silver, steel, etc.

Candlestick ShadowFor a candlestick chart, the body or real body is the wide or colored part of a candle that represents the range between the opening and the closing prices over a specific time period (minute, hour, day, week or other).  They are the most basic building block for candlestick charts.

Candlestick Shadow

A point on a candle stick chart representing a specific time period (a day, an hour, a minute, etc) in which the underlying stock price has moved. Candlesticks will have a body and usually two wicks – one on each end. For a white (could also be green) candlestick, the bottom of the body represents the opening price and the top of the body represents the closing price.  For red candlesticks, it is just the other way around. The top and bottom tips of each wick are the day’s highest and lowest price respectively.

Candlestick Shadow

A small line (like a candle wick) found at the top or bottom of an individual candle in a candlestick chart. The shadow illustrates where the price of a stock has fluctuated relative to the opening and closing prices. A shadow can be located either above the opening price (upper shadow) or below the closing price (lower shadow). These shadows illustrate the highest and lowest prices at which a security has traded during a specific period of time. When there is a long shadow on the bottom of the candle (like that of a hammer) there is a suggestion of an increased level of buying and, depending on the pattern, potentially a bottom.

An investment strategy that aims to capitalize on the continuance of existing trends in the market. The momentum investor believes that large increases in the price of a security will be followed by additional gains and vice versa for declining values.

Resistance line

A point or range in a chart that caps an increase in the price of a stock or index over a period of time. An area of resistance, resistance line or resistance level indicates that the stock or index is finding it difficult to break through it, and may head lower shortly. The more times that the stock or index tries unsuccessfully to break through the resistance line, the stronger that area of price resistance becomes.

How To Use Price-To-Sales Ratios To Value Stocks
The price-to-sales ratio (Price/Sales or P/S) provides a simple approach: take the company’s market capitalization (the number of shares multiplied by the share price) and divide it by the company’s total sales over the past 12 months. The lower the ratio, the more attractive the investment. As easy as it sounds, price-to-sales provides a useful measure for sizing up stocks. But investors need to be mindful of the ratio’s potential pitfalls and possible unreliability.

How P/S Is Useful
In a nutshell, this ratio shows how much Wall Street values every dollar of the company’s sales. Coupled with high relative strength in the previous 12 months, a low price-to-sales ratio is one of the most potent combinations of investment criteria. A low P/S can also be effective in valuing growth stocks that have suffered a temporary setback.

In a highly cyclical industry such as semiconductors, there are years when only a few companies produce any earnings. This does not mean semiconductor stocks are worthless. In this case, investors can use price-to-sales instead of the price-earnings ratio (P/E Ratio or PE) to determine how much they are paying for a dollar of the company’s sales rather than a dollar of its earnings. P/S is used for spotting recovery situations or for double checking that a company’s growth has not become overvalued. It comes in handy when a company begins to suffer losses and, as a result, has no earnings (and no PE) with which investors can assess the shares.

Let’s consider how we evaluate a firm that has not made any money in the past year. Unless the firm is going out of business, the P/S will show whether the firm’s shares are valued at a discount against others in its sector. Say the company has a P/S of 0.7 while its peers have higher ratios of, say, 2. If the company can turn things around, its shares will enjoy substantial upside as the P/S becomes more closely matched with those of its peers. Meanwhile, a company that goes into a loss (negative earnings) may lose also its dividend yield. In this case, P/S represents one of the last remaining measures for valuing the business. All things being equal, a low P/S is good news for investors, while a very high P/S can be a warning sign.

Where P/S Fall Short
That being said, turnover is valuable only if, at some point, it can be translated into earnings. Consider construction companies. They report very high sales turnover, but, with the exception of building booms, they rarely make much in the way of profit. By contrast, a software company can easily generate $4 in net profit for every $10 in sales revenue. What this discrepancy means is that sales dollars cannot always be treated the same way for every company.

Many people look at sales revenue as a more reliable indicator of a company’s growth. Granted, earnings are a complicated bottom-line number, whose reliability is not always assured. But, thanks to somewhat hazy accounting rules, the quality of sales revenue figures can be unreliable too.

Learn how to use penny stocks & beat the stock market!
Comparing companies’ sales on an apples-to-apples basis hardly ever works. Examination of sales must be coupled with a careful look at profit margins and their trends, as well as with sector-specific margin idiosyncrasies.

Debt Is a Critical Factor
A firm with no debt and a low P/S metric is a more attractive investment than a firm with high debt and the same P/S. At some point, the debt will need to be paid off, so there is always the possibility that the company will issue additional equity. These new shares expand market capitalization and drive up the P/S.

Companies heavy with corporate debt and on the verge of bankruptcy, however, can emerge with low P/S. This is because their sales have not suffered a drop while their share price and capitalization collapses.

So how can investors tell the difference? There is an approach that helps to distinguish between “cheap” sales and less healthy, debt-burdened ones: use enterprise value/sales rather than market capitalization/sales. By adding the company’s long-term debt to the company’s market capitalization and subtracting any cash, one arrives at the company’s enterprise value (EV).

Think of EV as the total cost of buying the company, including its debt and leftover cash, which would offset the cost. EV shows how much more investors pay for the debt. This approach also helps eliminate the problem of comparing two very different types of companies:

The kind that relies on debt to enhance sales and

The kind that has lower sales but does not shoulder debt.

The Bottom Line
As with all valuation techniques, sales-based metrics are just the beginning. The worst thing that an investor can do is buy stocks without looking at underlying fundamentals. Low P/S can indicate unrecognized value potential – so long as other criteria like high profit margins, low debt levels and growth prospects are in place. In other cases, P/S can be a classic value trap.

High inflation and high unemployment occurring simultaneously.

Definition

A security with a guarantee of a return rate that is higher than the rate of inflation if it is held to maturity. Inflation-indexed securities link their capital appreciation, or coupon, to inflation rates. Investors who are seeking safe returns with little risk often hold inflation-indexed securities.

An inflation-indexed security guarantees a real return. Real return securities are usually bonds or notes, but may also come in other forms. Since these types of securities offer investors a very high level of safety, the coupons attached to such securities are typically lower than notes with a higher level of risk.

The fee charged by a broker or investment advisor in exchange for investment advice and/or handling the purchase or sale of a security. Commissions vary from brokerage to brokerage.

There are two basic types of broker. Discount brokerages offer little or no advice. These type of brokerage companies can be problematic for rookie investors but save a lot of money for those who have a basic understanding of the market. On the other hand, full-service brokerages offer more services, but commissions are much higher.

There is potential for a conflict of interest between brokerages and their clients when a commission is charged. For agents that make most of their money from commissions, they do not get paid if their clients do not do regular trades. Unethical brokers have been accused of encouraging clients to conduct more trades than necessary.

Past performance is not an indication of future performance. How many times have you heard that? Of course, earnings estimates provide one strong measure of potential future performance and are a mainstay of stock investing research.

Earnings estimates are exactly what they sound like: an estimate of forecasted earnings. Notice the built in ambiguity? It’s there for a good reason. Revised estimates are a given contingent upon market conditions, the overall economy and other unforeseen forces impacting the profitability of the company.

You might wonder how analysts get away with forecasting earning estimates only to revise them, repeatedly, at the first sign of trouble. All too often, the average investor has already acted on the first estimate and is left holding a rapidly declining security – sans fees. Is there a solution? Yes, search for companies with upwardly revised earnings estimates and steadily rising analyst ratings.

What are they doing with your money? Have you ever wondered how well your money is really being managed by the corporations you hand it over to? After all, the media is full of stories about CEO compensation reaching new heights, buy-outs of non-profitable holdings, million dollar birthday parties and other horror stories.

Return on Equity (ROE) is used to measure how much profit a company is able to generate from the money invested by shareholders. Think of this way; if your teenager asked to borrow $1,000 to start-up a small side business then chances are you would comply. When they came back to ask for $10,000 you would examine how well they performed with the initial $1,000 before making the next loan.

It makes such good sense that you might wonder why more people don’t use this handy little measure before pouring massive sums into a money pit masking as a company. Join the ranks of those in the know. ROE is easy to compute and provides valuable insight into the workings of the company. Think twice before investing in a company with a negative ROE. Instead, search out self-sustaining companies with a healthy ROE that indicates the willingness and ability to use invested dollars for future growth rather than operating expenses. A good ROE is 15% or better so keep your eyes and ears open for opportunity.

What is the PEG, or Projected Earnings Growth? In the article on Price to Earnings Ratio or P/E, I mentioned that this number gave you an idea of what value was placed on a company’s earnings. The P/E is the most usual way to compare the relative value of stocks based on earnings since you calculate it by taking the current price of the stock and divide it by the Earnings Per Share (EPS).

This helps identify if a stock’s price is high or low relative to its earnings. Some will say a company with a high P/E is overpriced and they may be correct. A high P/E may warn you that traders have raised a stock’s price past the point where any acceptable near term growth is feasible. But, a high P/E may also signal that the company still has strong growth prospects in the future, which could predict an even higher PPS (price per share).

Because the market cares more about the future than the present, it is always looking for some way to predict it. Another indicator you can use to help you look at future earnings growth is called the PEG ratio. Price/Earnings To Growth, is a valuation metric for determining the relative trade-off between the price of a stock, the earnings generated per share (EPS), and the company’s expected future growth. PEG is a widely employed indicator of a stock’s possible true value.

You calculate the PEG by taking the P/E and dividing it by the projected growth in earnings. PEG = P/E / (projected growth in earnings). For example, a stock with a P/E of 60 and projected earning growth next year of 30% would have a PEG of 2 (60 / 30 = 2). What does the “2” mean? Like all ratios, it simply shows you a relationship. In this case, the lower the number the less you pay for each unit of future earnings growth. So even a stock with a high P/E, but high projected earning growth may be a good value. In other words, a lower ratio is “better” (cheaper) and a higher ratio is worse” (expensive). The PEG ratio of one represents a fair trade-off between the values of cost and the values of growth, then the stock is reasonably valued given the expected growth.

Similar to PE ratios, a lower PEG means that the stock is undervalued more. It is favored by many over the price/earnings ratio because it also accounts for growth. If a company is growing at 30% a year, then the stock’s P/E could be as high as approximately 30. PEG ratios between 1 and 2 are therefore considered to be in the range of normal values. A crude analysis suggests that companies with PEG values between 0 to 1 may provide higher returns. Looking at the opposite situation; a low P/E stock with low or no projected earnings growth, you see that what looks like a value may not work out that way. For example,a stock with a P/E of 8 and flat earnings growth equals a PEG of 8. This could prove to be an expensive investment.

A few important things to remember about PEG:  (a) Investors may prefer the PEG ratio because it explicitly puts a value on the expected growth in earnings of a company. The PEG ratio can offer a suggestion of whether a company’s high P/E ratio reflects an excessively high stock price or is a reflection of promising growth prospects for the company. (b) The PEG ratio is less appropriate for measuring companies without high growth. Large, well-established companies, for instance, may offer dependable dividend income, but little opportunity for growth. (c) A company’s growth rate is an estimate. It is subject to the limitations of projecting future events. Future growth of a company can change due to any number of factors: market conditions, expansion setbacks, and hype of investors. (d) The convention that (PEG=1) is appropriate is somewhat arbitrary and considered a rule of thumb metric.

The question of when to sell stocks is not easily answered. On the one hand, you know a correction is coming but the question of “when” isn’t so clear. Anyone who has ever sold early only to stand by and watch others reap in huge profits have felt the pain of premature sales.

Sure, once the correction finally comes you might have some consolation but by that point your brother-in-law has a new convertible so what do you care that you were “right” but just a little early. Of course, the only thing worse than selling out early is selling late. Nobody wants to be the idiot holding the hot potato once the market cools. So, where is the happy medium?

1. Set a Sell Strategy in Advance… then stick to it! What is your performance goal for this stock? If it is 10% then sell when it reaches 10% and move on. Learn not to look back. Everyone has those “could have – would have” stories.
2. Cut Losers. Admit when you have made a mistake. Live and learn. It’s part of the game.
3. Put it into writing. Use trailing stops or stop loss orders and other techniques to remain focused and take the emotion out of the equation.

Definition

Stock Volatility is the measurement of how much a stock moves up and down in a given amount of time. The more volatile the stock, the more “movement” you will see in its stock chart.

Example

Consider the following 3 stocks:

volatility

All 3 of these stocks had the same growth rate between period 1 and period 12, but they had very different volatility.

Stock 1 was the least volatile, growing at a constant rate throughout the entire time.

Stock 2 was in the middle, it moved up and down but was fairly consistent.

Stock 3 was very volatile, with huge swings up and down over time.

How Do We Use It?

How you treat volatility depends on how you see yourself in the stock market. The average investor, who makes fairly few trades and is just trying to make their savings grow, does not like volatility, since they want consistent returns over time. Traders, who often trade multiple times per day, are trying to always “buy low and sell high”, so stocks that move up and down a lot are the best place to make profit.

However, a few bad trades, where a trader accidentally “sells low and buys high” can cause huge losses. For this reason, most investors concerned with “Capital Preservation” try to avoid volatility.

For more information on volatility, and how it affects your portfolio, read about the Sharpe Ratio (Beginner).

Congratulations! You just made your first stock trades and now you’re sitting back waiting for them to take off and make you a millionaire.

You see a few of them inching higher just like you had hoped, but one of your stocks is starting to fall. It is the moment of truth. Should you sell the loser and cut your losses? Is there a chance it will recover? What should you do if it doesn’t? One big loser can eliminate a solid year of gains — don’t let this happen to you.

The stock market slide in 2008 cost investors over $1 trillion in paper losses. This bear market has been the wake up call which reminds us of the risk inherent in the stock market, and more importantly, the need to protect our portfolios from major losses. It is impossible to predict what the market will do today, tomorrow or next year, but there is one thing that is definite: markets go up, they go down, and they stay the same.

There is so much information available about how to find the hot stocks, yet there is very little information available about how to handle the stocks you already own. One of the many overused market clichés is “Ride your winners and cut your losses.” However, this is one that must be followed. As an example, suppose you pick 10 stocks and invest $10,000 in each one. At the end of the first year if 7 of the stocks are up 10%, two are unchanged, and one has gone bankrupt, your $100,000 portfolio is now $97,000. That math doesn’t seem right at first: you picked 7 winners and only one loser. However, the math doesn’t lie. If you think only suckers hold stocks that go bankrupt, let me remind you of such blue chippers as MCI, KMart, Enron, GM and many others that were once huge stocks and now cease to exist. The rule of thumb is to limit your losses to 10% or less.

So in our example, if you had sold your loser at $9,000 (a 10% loss) instead of holding it to the bitter end, your portfolio would have been worth $106,000. The lesson here is that the stock market is full of risk and every dollar that you invest in a stock is at risk for a 100% loss. That doesn’t mean that you shouldn’t be investing in the market; it simply means that you should be taking every precaution to ensure that you minimize your losses.

Using Stop Loss Orders

When you buy a stock, there is a way to ensure that you minimize your losses on all of your trades. By placing stop losses on all of your trades, you virtually guarantee that your losses do not exceed a certain amount. A stop loss is an order placed with a broker to sell a security when it reaches a predetermined price or percentage. For example, if you buy Apple (AAPL) for $150 and you do not want to lose more than 10% of your investment, you simply place a stop order at $135. If Apple’s price drops below $135, your holding is automatically sold. Similarly, if you bought AAPL at $100 and it is trading at $150 then you currently have a nice profit of $50 a share, or 50%. At this point you can lock in your profits, and put in a stop order at $120 and enjoy the peace of mind. One advantage of using stop losses includes peace of mind; the ability to step away form your computer without worrying that you will lose your savings while you are gone and eliminating some of the inherent dangers of volatility in the market. Stop losses enable traders act with logic and discipline. Stop losses make sure you stay on track. If you always put a 5% stop on all your trades, you assure yourself that you will NEVER lose more than 5%. A stop loss is a straightforward, simple tool that allows traders to minimize losses, yet many people do not use them.

Take risk out of the market and practice using stop losses in your How The Market Works portfolio. So, what stop loss percentage should you use? William O’Neil, the founder of Investor’s Business Daily, has done lots of research on this topic and his recommendation is 8%. As soon as you buy a stock, immediately but a stop loss at 8%. Revisit that order every month and if your stock has increased in price, adjust your stop loss order accordingly. A more dynamic strategy gaining a lot of attention lately is from a company called SmartStops.net, founded by Chuck Lebeau. SmartStops provides both short-term and long-term stops that trigger when your stock or ETF fall into that range. Smartstops uses advanced mathematics that adjusts to follow an uptrend longer but quickly react to a downturn.

The golden rule of stock investing dictates cutting your losses when they fall 10 percent from the price paid, but common wisdom just might be wrong. Instead, use some common sense to determine if it’s time to hold or fold.

  • Diversification. If your total portfolio is down 10 percent, but diversified then the diversification itself is one layer of protection. Don’t automatically assume you need to sell all of your stocks and start over.
  • Dividends. If the stock pays dividends, then calculate the total dividend plus stock price in your estimates before making the decision to sell.
  • Dumb Pricing. If you paid too much to begin with, then a 10 percent correction will often work it’s way out if you hold a bit longer. Just stop buying high and learn your lesson in the future. Then again, extra caution is advised because if you bought wrong to begin, then there is little chance you have the required savvy to know when it’s time to fold.

The final rule of investing is to make informed decisions so instead of blindly following the 10 percent rule, use the following recovery estimates and averages. Remember, a 25 percent return on investment is a strong return, 100 percent is very rare. Beyond that is a long tail that cannot be relied upon or properly forecasted. With that in mind …

If stock drops Then the stock must gain to break even
5% 5.26%
10% 11.1%
20% 25.0%
30% 42.86%
40% 66.67%
50% 100%

As this table shows, cutting your losses quickly in a losing stock and reinvesting in another stock is often the smart play.

If you are fortunate enough to be seriously contemplating a partnership with a well-known hedge fund then you don’t need to be reading this. For the rest of you, a hedge fund is one of the investment tools you will aspire toward as a serious investor.

The first hedge fund came out in 1949 as a strategy to neutralize the effect of overall market movements on a portfolio. The strategy was simply to buy stocks that were expected to rise and selling short stocks expected to fall. The concept was to add BALANCE — to produce returns that were not market-dependent and tended to hedge a portfolio’s market exposure. Nowadays, that has changed in a very fundamental way; besides protecting a portfolio from downside risk, hedge funds often go for maximum return by deploying large amounts of leverage and investing in several asset classes among global markets.

The typical hedge fund is designed to be a partnership arrangement with the fund manager acting as the general partner responsible for making investment decisions. To join, you must be an “accredited investor” which is defined as a person with a net worth of at least $1 million (or an annual income of at least $200,000 for the past two years and expectation of continued income in that range). These levels are due to increase. These private investment funds are usually not registered with the SEC and use complex investment strategies in order to secure a targeted rate of return. For this reason, they are not marketed to the average investor, but instead to high worth individuals and professional investors. For those aspiring toward this goal, here is what you will need to get started:

  • An average starting investment of $250,000 – $500,000 USD. Although some “so-called” funds start as low as $10,000 it is uncommon. Top hedge funds require as much as $10,000,000 or more to play.
  • The ability to lose money. When it comes to hedge funds, you have to pay to play. Even if the hedge fund loses money, you will owe management fees and other costs and of course, your principal is at risk.
  • Acceptance. Remember, hedge funds are typically formed as partnerships. There are over 6,000 funds available, but they don’t take just anyone. By law, you must be a qualified investor and able to meet specific guidelines.
 Book: Hedge Funds Demystified
 Book: Create Your Own ETF Hedge Fund: A Do-It-Yourself ETF Strategy for Private Wealth Management
 Book: An American Hedge Fund: How I Made $2 Million as a Stock Operator and Created a Hedge Fund
 Book: Hedge Hunters Hedge Fund Masters on the Rewards, the Risk, and the Reckoning
 Book: Hedge Fund Masters: How Top Hedge Fund Traders Set Goals, Overcome Barriers, And Achieve Peak Performance

In simplistic terms, buying what you know takes advantage of your familiarity with a product or market and translates that knowledge into potential earnings. Think of it this way; good investors understand opportunity and risk. They weigh the opportunity against the risk in order to determine the value of a potential investment. Without knowledge of the industry you don’t have a method of ascertaining the reliability of information, ratios or reports associated with any company or stock. Warren Buffet calls it the “circle of competence” but more often than not, the “circle of incompetence” may better describe the majority of lay investors. Use these quick steps to identify potential sectors that would allow you to buy what you know:

  • Jot down areas of expertise and interest. This might consist of formal education and training or simply a hobby.
  • Narrow your list by selecting those items you enjoy learning more about. Buying what you know also requires diligent research to stay abreast of changing markets.
  • Research the industry.
  • Research individual stocks.

Small cap stock investing is volatile. That is one of first things you should know and understand. So, why risk your money by investing in what is typically considered risky business? First and foremost – increased risk equals increased potential reward. However, there is another way to look at it. Investing in risk can actually decrease the total risk of your portfolio. Here is how it works. By diversifying your portfolio to include high volatility, moderate and minimum risk instruments the overall return tends to be greater thereby actually eliminating risk by increasing volatility. Small cap stock are defined as those companies with a market cap of less than $1 billion (calculate market cap by multiplying share price by number of outstanding shares). Size matters when it comes to small cap stock investing. Just ask yourself, what is easier to do – double your money from $1 to $2 or double $1 million to $2 million. It’s a no-brainer. The same applies to corporations. Growth becomes more difficult as the company grows beyond a certain point, but the rewards for finding the right company in the early growth stage can lead to the type of returns every investor dreams of. Use these quick tips when searching for small cap stocks:

  • Understand the market. Yes – we are saying it again for a reason. The fundamentals never go out of style and there are few places this is more true than investing in small cap stocks.
  • Don’t believe the better mouse-trap theory. You know the old adage “build a better mouse-trap and they will come.” The reality is closer to “imitation is the best form of flattery.” Before you bet the farm on the next new and improved technology, remember how much money is required to bring it to market.
  • Stay involved with the company. Read and understand the company information itself. Who is at the helm? What is their prior experience? The best plans fall apart without proper guidance.

Small Cap Stock Selection Checklist

Not sure what to look for when purchasing small cap stock? Use this small cap stock selection checklist to make sure you cover the basics:

  • Earnings. Look for a rise in current and annual earnings. Some investors will use a 25 percent increase in current earnings per share, but that is heavily contingent upon prevailing market conditions and the industry averages.
  • Volume. Trading volume is critical especially when dealing with small cap stocks. Remember, to make a profit you need someone willing and able to buy what you are selling.
  • Institutional sponsorship. Look for investment by mutual funds and other large institutional buyers.
  • Growth. Read analyst reports for growth forecasts of 15 percent and up.
  • Revenue. Look for revenue or sales growth of at least 15 percent change above year over year rate.

Hyperinflation refers to out of control or extremely rapid inflation, where prices increase so quickly that the concept of real inflation becomes meaningless. The classical definition of hyperinflation is inflation greater than 50% per month. Recently, Argentina, Brazil and Peru (1989-90) all experienced hyperinflation. Perhaps the most well known example of hyperinflation occurred in Germany from 1922-1923 where the average price for all goods and services increased 20 billion times. Prices doubled every 28 hours for 20 months! Some Germans were seen carrying cash in wheelbarrows to buy a loaf of bread.

Hyperinflation often occurs during periods of economic depression where there is a large increase in the money supply that cannot be supported by economic growth. It can also occur during periods of war where there is a loss of confidence in a country’s currency to maintain its value after the war is over.

Hyperinflation Trading Strategies

  • When an investor expects inflation, buy companies that sell or produce gold, as well as other commodities, since tangible assets will increase in price with the rate of inflation. Today, the world’s largest producer of gold is Barrick Gold (ABX)
  • Buy physical Gold Bullion coins or bars and keep it at home. In times of Hyperinflation, banks may fail or be closed for “holiday”. Having gold in your hand can buy just about anything when cash becomes worthless.
  • Invest in large companies who can easily adjust prices higher in the wake of inflationary times.
  • Buy Treasury Inflation-Protected Securities (TIPS) and other inflation protected investment vehicles.
  • Buy Real Estate Investment Trusts (REITs) because real estate will also rise in value as other prices rise.

Inflation

Inflation refers to the general rising of prices for goods and services in the economy, due to an increase in the amount of money and/or credit available. This can be caused by an increase in the level of government spending, and/or a decrease in taxes, giving individuals and businesses more income to spend on goods and services. When this occurs, the purchasing power of your dollar falls. For example, if the rate of inflation is expected to be 2% this year, a $1.00 chocolate bar will cost $1.02 at the end of the year. Central banks in each domestic economy attempt to keep inflation between 2-3% per year, to avoid rapidly increasing prices. Investors have several options to protect themselves from inflation. These stock sectors include:

  • Large retail companies that are able to easily adjust prices higher.
  • Companies that sell or produce commodities like oil, copper, gold and silver because these hard assets will rise in value along with inflation.
  • Real estate investment trusts (REITs) which also rises in value with overall rising prices.
  • Treasury Inflation-Protected Securities (TIPS) which are inflation adjusted bonds that protect wealth against rising prices.

When inflation starts to increase by large amounts, 50 or 100 percent per year, that is called “hyper” inflation and the value of a currency starts to fall quickly.

A CD or Certificate of Deposit is one of the safest and liquid forms of investment available. Insured by the FDIC (Federal Deposit Insurance Corporation), CDs are a type of interest earning deposit account. Unlike savings accounts, a CD requires a fixed sum of money for a fixed period of time ranging from six months to several years. CDs are attractive to investors because they typically pay a higher rate of interest than a traditional savings account and have FDIC insurance up to $100,000. Don’t expect to get rich from investing in CDs but they are a valuable addition to any portfolio to assist in providing liquidity. Use these quick tips to get started in purchasing and investing in CD’s:

  • Use a ladder approach to purchasing certificates of deposit. By using a ladder approach you spread out the interest rates and redemption times. Should you need to cash in a CD you will have more options available and lose the least amount of potential interest.
  • If investing more than $100,000 spread it between two or more banks or brokers. Remember, FDIC insurance only covers up to $100,000 per entity.
  • Confirm the maturity date – see it in writing before signing or finalizing the purchase. CDs can mature in as little as six months or as long as twenty years.
  • Confirm the interest rate and yield. Is the interest rate fixed or variable?
  • Understand penalties and early withdrawals. Pre-payment penalties, early withdrawal fees and other related items can dramatically impact yield.

Most of the broadly-used market indexes today are “cap-weighted” indexes, such as the S&P 500, Nasdaq, Wilshire, Hang-Seng and EAFE indexes. In a cap-weighted index, large price moves in the largest components (companies) can have a dramatic effect on the value of the index. Some investors feel that this overweighting toward the larger companies gives a distorted view of the market, but the fact that the largest companies also have the largest shareholder bases makes the case for having the higher relevancy in the index.

Market capitalization is calculated by multiplying the market price of stock by the number of issued shares of stock. Using an overly simplistic example, let’s assume the price per share of stock for company X is $10 and they have issued 1 million shares for a total market capitalization of $10 million. By this point a few questions should immediately come to mind including:

  • What is the total market for this given service or product? If company X in the above example was selling bejeweled dog collars for miniature tea cup sized poodles then will the demand warrant the total investment. Seems simple enough but novice investors might be surprised to learn how frequently a company over-estimates the total demand for a given product. This is particularly true with new and/or un-proven technology. The classic example is Beta video tapes. Although VHS video tapes went on to predominate the market, for a variety of reasons, the demand for Beta remained insufficient to take the lead.
  • What is the anticipated penetration level? Are the estimates realistic? It doesn’t matter if Company X is the only one today…they still can’t expect 100% market penetration because as soon as they become profitable copy-cat companies will move in. Without the start-up costs they might even have a distinct price advantage. Further, compare market capitalization with expected saturation levels. The more risky and/or unproven then the more conservative conservative penetration and saturation estimates should be for any given company.
  • Does the market capitalization level reflect the actual opportunity? Here is an example from a newly funded start-up. Company ABC operates in a $6 Billion dollar industry within the health care arena. The IPO was $50 million and they were quickly listed on NASDAQ. Closer scrutiny reveals that the sub-industry within which they operate is only a $40 million dollar annual industry. While it is true the industry is shifting toward the new technology, due to regulatory and insurance reimbursement schedules, that shift will require major overhaul and recognition before going mainstream.

Market / systemic risk is a measure of how much of a loss an investor is facing while trading. The market risk is usually measured using the beta of the stock that is being held in his/her portfolio.  Sometimes called “Systematic Risk,” it can happen for various reasons such as bad financial news or changes to the current rates. Because of the low-level of control investors have over this risk, portfolios generally can not be hedged against it.