The descending flag shows as a continuation pattern. The flag is built by two straight downward parallel lines which is shaped like a rectangle. It is oriented in the direction of that trend which it consolidates. Contrary to a bearish channel, this pattern is quite short term and shows the fact that buyers will need a break.
The creation of an descending flag will occur in an upward trend. Often, this break will occur halfway through the movement.
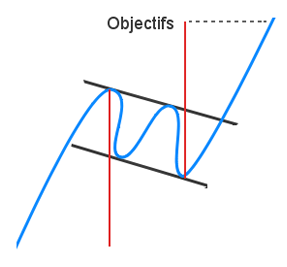
The object calculation will be compared to the previous trend. A calculation of the height of the overall upward trend before the formation of the descending flag and then extends the low on the last lowest point of the pattern.
A graphical representation of a descending flag follows:

Look at some statistics about the descending flag:
– In 87% of cases, there is an upward exit.
– In 90% of cases, the descending flag shows a continuation pattern.
– In 62% of cases, the target of the pattern will be reached .
– 76% of cases, the descending flag occurs when the price is at the highest third of its annual range.
– In 10% of cases, a pullback occurs on the support.
The more the previous movement precedes the formation of the descending flag it is powerful, the more the bullish breakout will be strong.
The performance of a descending flag is not as important when it is oriented in the direction of the trend.
A descending flag with narrowed lines is performs more than a flag with outspread lines.
A descending flag is more powerful if there is no false breakout.