![]()
 Don’t you love the terminology that pictorially associates these charts with their graphic representations? The Head and Shoulders is an extremely popular pattern among investors because it’s one of the most reliable of all chart formations. It also appears to be an easy one to spot. Novice investors often make the mistake of seeing Head and Shoulders everywhere. Seasoned technical analysts will tell you that it is tough to spot the real occurrences.
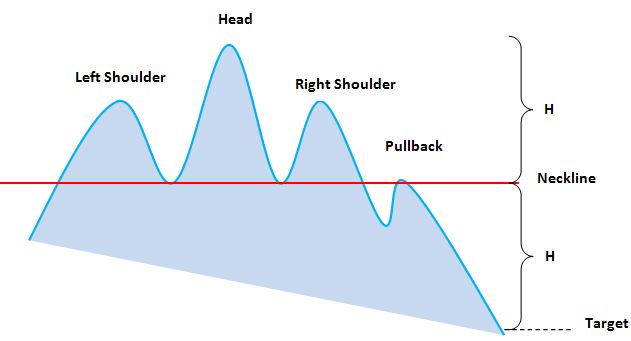
A Head and Shoulders is considered a bearish signal and that prices will fall after the formation is complete. A head and shoulders top chart has a left “shoulder,” a “head,” and a right “shoulder,” usually with a horizontal bar indicating a “neckline.” A mirror image of the top variety, a bottom head and shoulders chart looks like someone hanging upside down.
On the top side, left shoulders result at the peak of a sustained move with high volume numbers. The market reacts and prices decline, usually on lesser volume. Quickly, market value rallies upward to form the “head” on rather heavy volume. Then, fewer shares are traded, but mostly on the sell side, causing prices to drop. Subsequently, another rally occurs, which forms the right “shoulder” (not has high as the head). Finally, another sell off occurs, typically on lower volume numbers, again, and the “shoulder” is complete.
On the bottom side, the mirror image of buying/selling and increasing/decreasing market prices occurs. Analyzing this chart involves learning of the reasons, valid or not, for this volatile activity.
Take a look at this example of head and shoulders pattern in Gold that suggested a breakout A breakout occurs when a stock’s price moves up quickly above former resistance levels. higher was imminent: